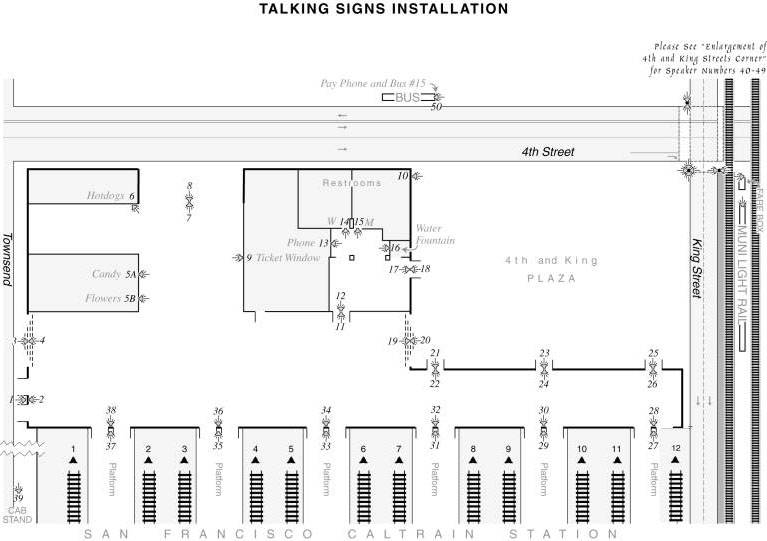
Figure 1.1 Talking Signs® Installation at Caltrain Station
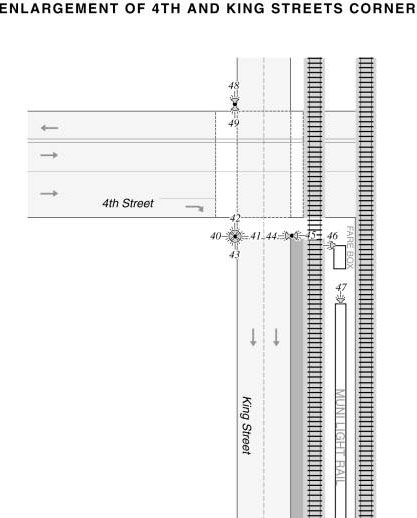
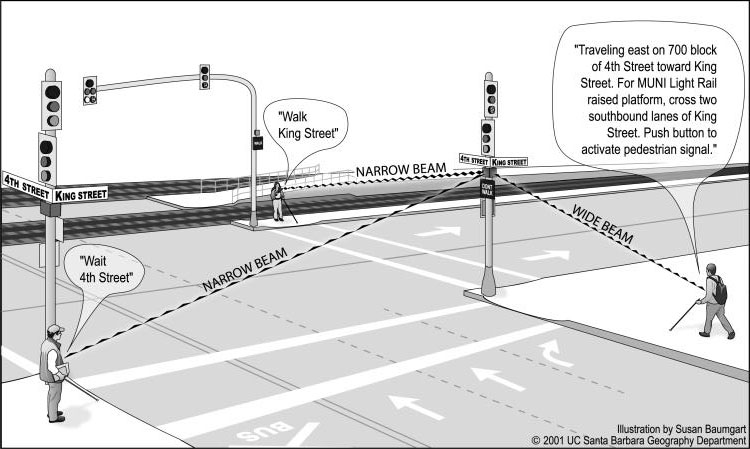
Figure 1.2 Street Corner Detail
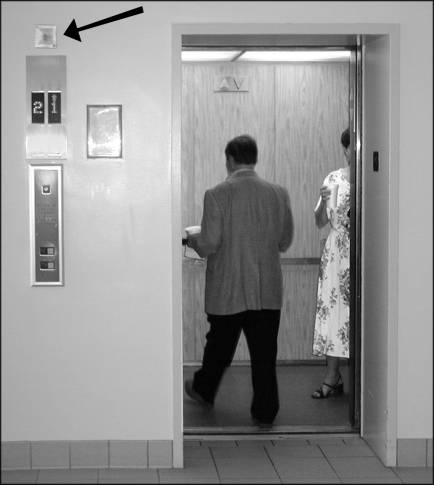
Figure 2.2 Transmitter Cover and Placement
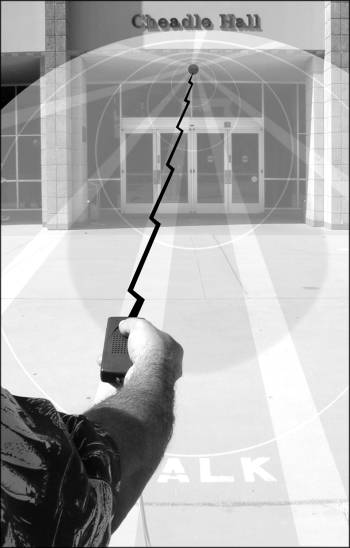
Figure 2.3 Directional Beam from Transmitter to Receiver
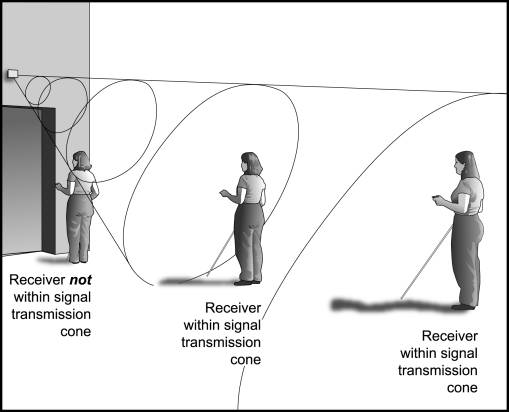
Figure 2.4 Cone Shaped Infrared Light Beam from Transmitter
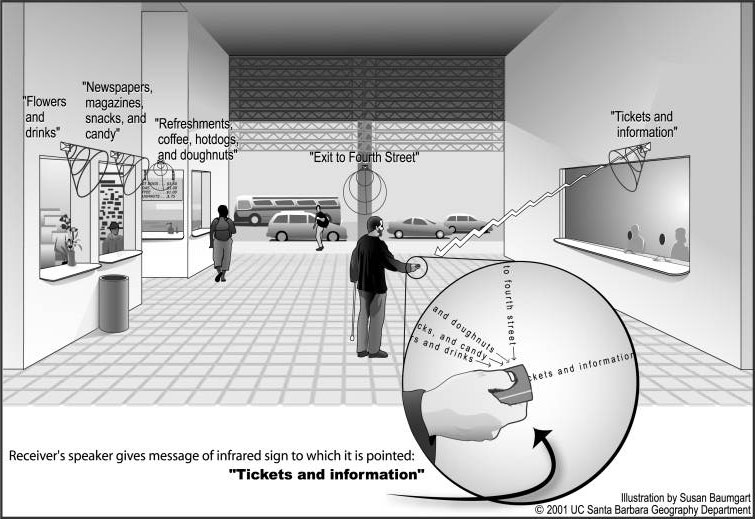
Figure 2.5 Transit Terminal Installation
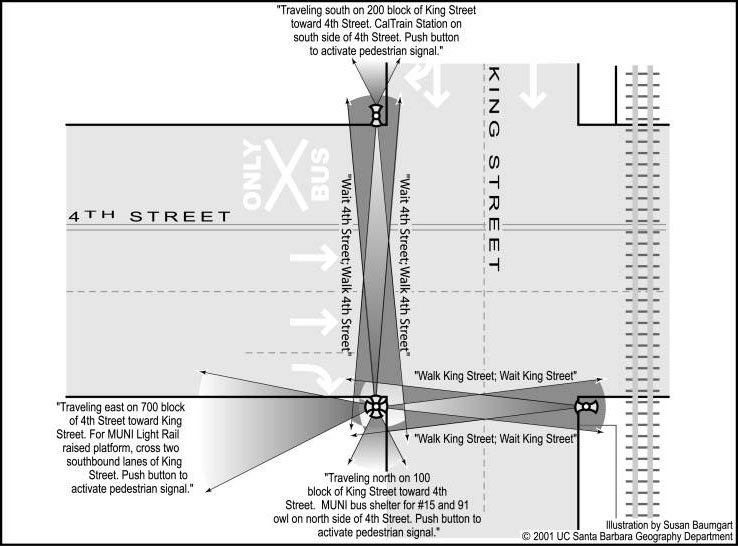
Figure 2.6 Typical Street Information and Coverage with RIAS
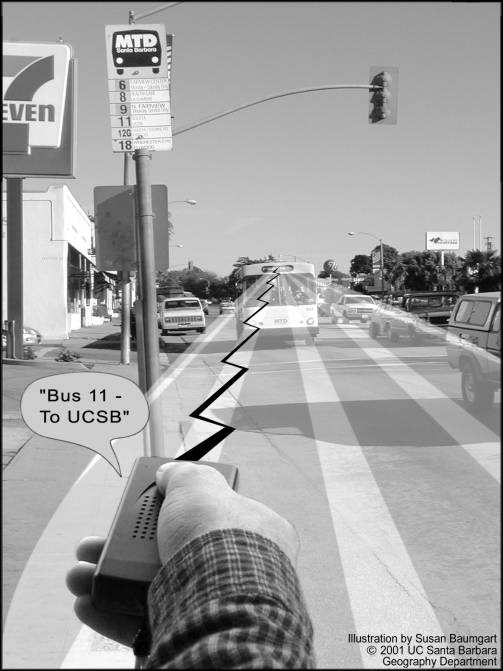
Figure 2.7 Using RIAS to Identify an Approaching Bus
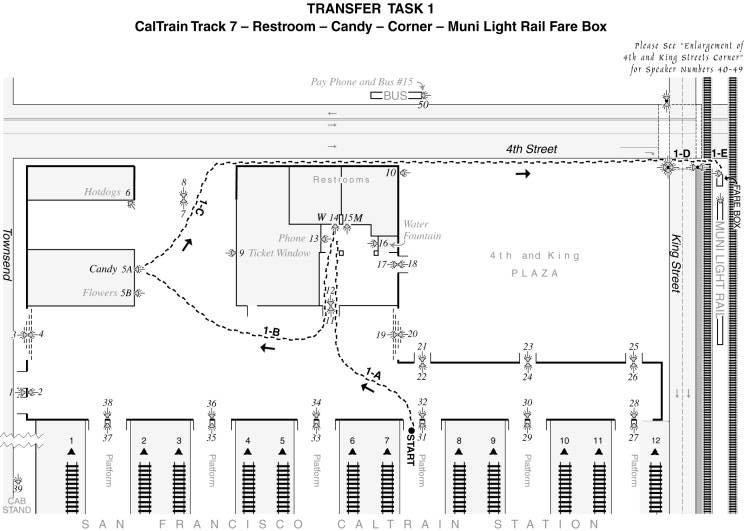
Figure 3.1 Transfer Task 1 Path of Travel
Figure 3.2 Excess Time using Regular Methods and RIAS - Task 1
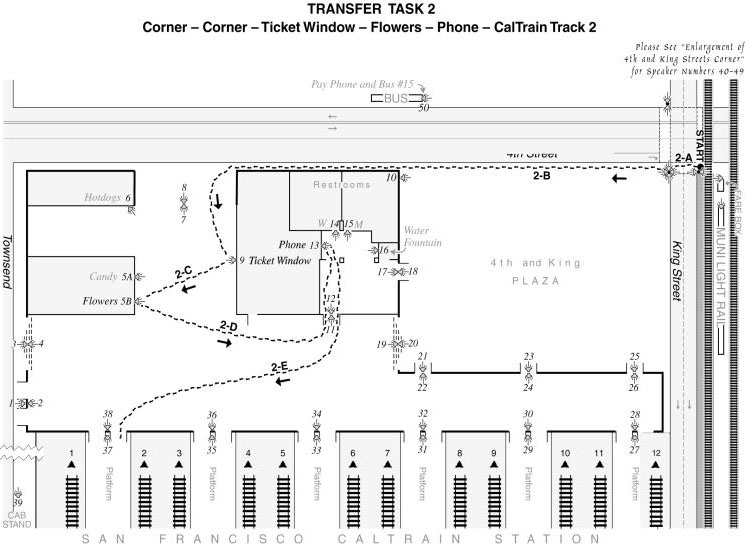
Figure 3.3 Transfer Task 2 Path of Travel
Figure 3.4 Excess Time using Regular Methods and RIAS - Task 2
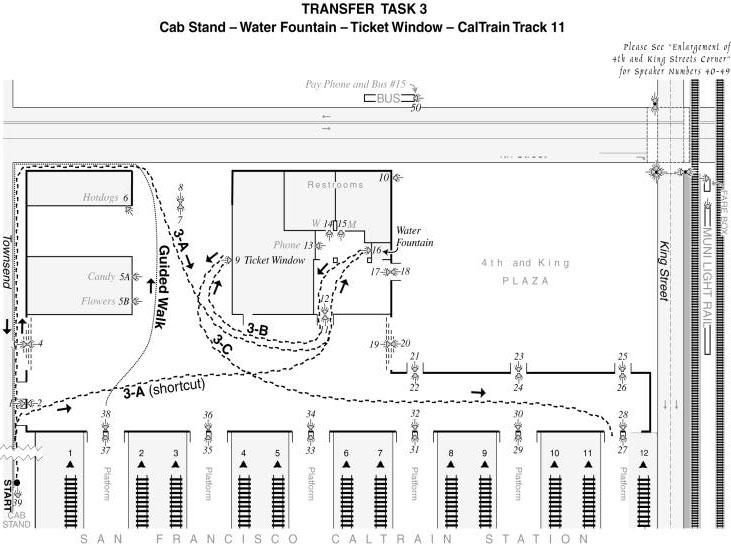
Figure 3.5 Transfer Task 3 Path of Travel
Figure 3.6 Excess Time using Regular Methods and RIAS - Task 3
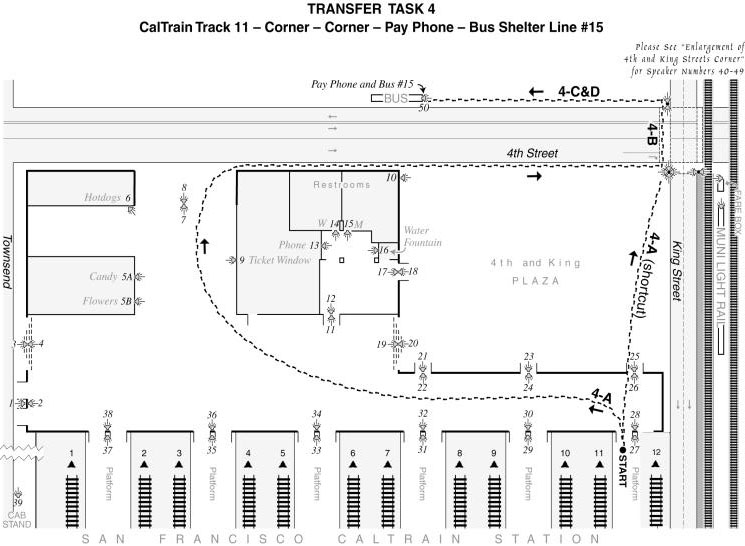
Figure 3.7 Transfer Task 4 Path of Travel
Figure 3.8 Excess Time using Regular Methods and RIAS - Task 4
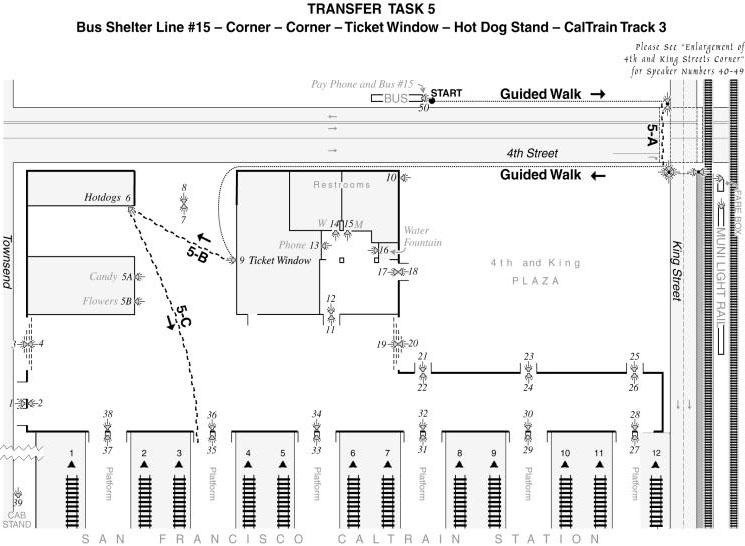
Figure 3.9 Transfer Task 5 Path of Travel
Figure 3.10 Excess Time using Regular Methods and RIAS - Task 5
Figure 3.11 Oblique View of RIAS Installation at King and 4th Streets
Figure 3.12 Difficulty of Transit Tasks
Figure 3.13 Travel Time Penalty for Four Specific Types of Tasks
Figure 3.14 Travel Time Penalty for Cue-based Location Tasks
Figure 4.1 Travel Times per Person
Figure 4.2 Total Trips per Person
Figure 4.3 Additional Trips Desired and Estimated
Figure 4.4 Additional Desired and Estimated Subject Participation
Figure 4.5: Data Points for Six Transfer Scenarios
Figure 4.6 Transfer Decisions in a Familiar Area
Figure 4.7 Transfer Decisions in an Unfamiliar Area
Figure 4.8 Effect of Area Familiarity on Perceived Transfer Decisions
Figure 4.9 Distance Impedance per Block
Figure 4.10 Frequency Distribution of Spatial Awareness