To identify how specific locations and tasks affect blind navigation, the travel
times in the two conditions to the FSU (familiar sighted user) were compared
(see Section 1.6.6 , Sighted Subjects for Baseline
). The excess travel time in the two conditions, compared to the FSU,
is expressed as a percentage of the baseline time. This standardized the
effect of different distances between the task locations. This method
shows the time penalty faced by people with vision loss, and how that penalty
is not consistent, but varies according to the characteristics of various locations,
including the non-visual cues available. This method allows for better
understanding of which locations present the biggest barriers to successful
and independent travel. Examining the time penalty also shows how the
use of RIAS affects the time required to perform these tasks. A few caveats
to better understand these data are:
 relative accessibility of activity k from location
i for person type l relative to person of type m .
relative accessibility of activity k from location
i for person type l relative to person of type m .
Person of type m is the sighted walker, and in the above example, 4
is the relative accessibility measure, or time penalty, when comparing a trip
from the station door to a boarding area for the two travelers. In the
following sections, a person of type l is used to represent the blind
person in either of the two test conditions, using regular navigation skills
(NRIAS ) or using RIAS. With this formulation, a relative
access score of 0.0 would represent a location that could be reached by the
sighted and the blind traveler in the same amount of time. A score higher
than 0.0 would represent an excess time penalty caused by lack of vision.
Figure 3.2 compares the excess travel time required for blind people with and
without the use of RIAS.
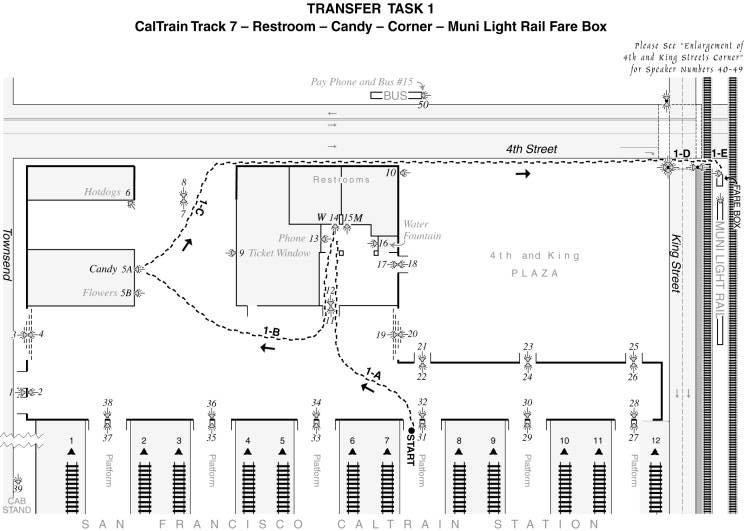
Figure 3. 2 Excess Time using Regular Methods
and RIAS - Task 1
3.1.2.2.1. Fare Box
In transfer task 1, the hardest location to find was the fare box at the Muni
rail station. The entrance ramp to the station was itself hard to locate,
and, since there were no turnstiles to signal the paid area, many people missed
the fare box. It was placed in a position that did not correspond with
typical “environmental grammar,” meaning a common and consistent
location. This location was categorized as an inconsistent or random
transit amenity location with no cues. The 15 subjects using their regular
method of travel took 1168% longer than the familiar sighted user (FSU).
A RIAS signal allowed easy access for the other 15 subjects who only took 87%
more time than the
FSU.
Using the first trial data only, t-test statistics for the two conditions, regular
method and RIAS, showed a significant difference (P<.00002).
After subjects that reported they could see shapes or objects up close were
eliminated, subjects who had no vision at all had t-tests that showed a significant
difference (P<.00002). The subjects with no useful vision are discussed
later (see Section 3.5.1 , Accessibility of
Grouped Tasks and Locations ).
3.1.2.2.2. Bathroom
The bathroom was located in a waiting room off the main terminal area.
Once the waiting room is located, there are many obstacles of chairs, people,
and pillars. The bathroom doors had the standard round (F) or triangle
(M) tactile information. This location was categorized as an amenity
with few cues. Subjects using their regular method took 575% longer than
the FSU. The RIAS subjects took 304% longer than the FSU,
partially due to the various obstacles in the waiting room.
The t-test statistics for the two conditions showed a significant difference
(P<.01). For those subjects with no vision, t-tests showed a significant
difference (P<.03).
3.1.2.2.3. Hard Street Crossing #1
Blind travelers use auditory cues from traffic to align themselves for a street
crossing and also to understand the flow of traffic. Turn lanes
and high-speed traffic confound these problems. This crossing of King
Street was quite difficult for many blind people. King Street is a high-speed
arterial road, and the nearest stop light from this one is two long blocks away
so traffic moves at a high speed. In addition, most of the cars on 4th
Street turn right onto King, so there is almost a constant flow of traffic,
except for the short walk cycle (see Figure 2.6 on page 59 ). This location
was categorized as a hard street crossing. Regular method subjects took
377% longer than the FSU, and, with RIAS, users took only 31% longer.
The t-test statistics for the two conditions showed a significant difference
(P<.004). For those subjects with no vision, t-tests showed a significant
difference (P<.009).
3.1.2.2.4. Candy Counter
This amenity was located in the main entrance hall of the terminal. There
were often people around and the voices of the counter clerks were audible.
The counter was “L” shaped and quite long and this arrangement
provided much room for errors by the subjects. Usually, subjects found
a part of a counter and then asked others if candy was sold there. The
smells of popcorn and candy did allow some users to locate the area when close.
Only after getting a verbal response from the clerk did they know their
location. This amenity was categorized as one with few cues. The
regular method subjects took 332% longer than the FSU, and, with RIAS,
this time was cut to 262%.
The t-test statistics for the two conditions showed no significant difference.
For those subjects with no vision, t-tests also showed no significant
difference.
3.1.2.2.5. Walk to Corner #1
From the candy counter, subjects were to walk out the main door, turned right,
and walk to the corner. Both long cane and dog users are well trained
in following curbs and using auditory cues to find street corners. The
regular method subjects took 147% longer, and the RIAS subjects
took 111% longer, than the FSU.
The t-test statistics for the two conditions showed no significant difference.
For those subjects with no vision, t-tests showed no significant difference.
Figure 3. 3 Transfer Task 2 Path of Travel
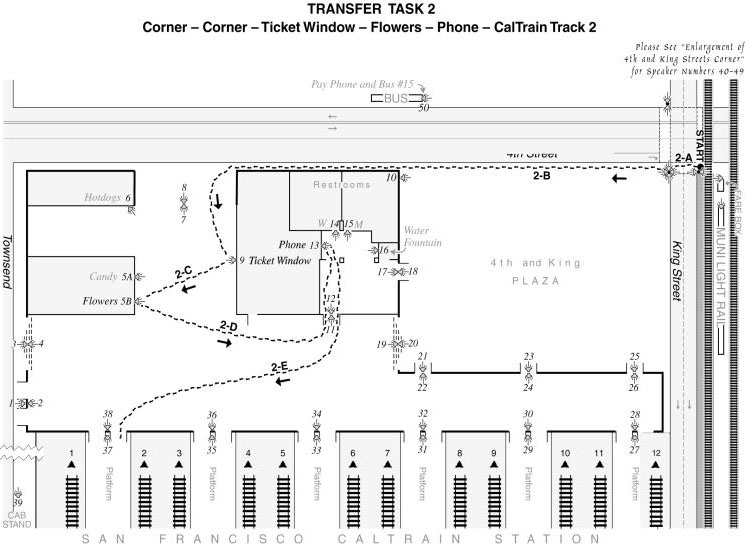
3.1.3. Transfer Task 2: Muni Corner to Track 3
For this task, 15 subjects used their regular skills first for all five sub-tasks,
and then they later repeated the same tasks using RIAS. Fifteen subjects
used the RIAS first and 10 people repeated the task later using their
regular skills. The t-tests statistics were calculated for analysis
of times between the two conditions, NRIAS 1 st versus
RIAS 2nd and RIAS 1 st versus NRIAS
2 nd . The t-test statistics were also calculated for the
30 RIAS scores and the 25 NRIAS scores, regardless of the order
of the condition.
|
Condition 1 |
Condition 2 |
Task |
From |
To |
NRIAS 1st |
RIAS 2nd |
NRIAS 2nd |
RIAS 1st |
| 2-A |
Corner |
Corner |
72s |
13s |
74s |
15s |
Because of the turn lanes and traffic flow at this crossing, the effects of
the RIAS were highly significant. Without RIAS there was much hesitation
and many mistakes. The results for the NRIAS 1st condition
were p<.006, for RIAS 1 st p<.002, and for 30 RIAS
subjects and 25 NRIAS subjects, regardless of order, the results were
also highly significant (p<.00004). There is no “learning”
effect over two attempts at a dangerous crossing like this one.
Thirteen subjects out of 25 without RIAS made a total of 20 unsafe attempts
to cross the street. Twelve of the 25 subjects using their regular method
missed the corner, another dangerous situation when traveling without vision.
One person out of the 30 using RIAS missed the corner. Two subjects
not using the system refused to even attempt the street crossing. The
times and errors show that, when using RIAS, there was little hesitation, and
that safety was vastly increased.
|
Condition 1 |
Condition 2 |
| Task |
From |
To |
NRIAS 1st |
RIAS 2nd |
NRIAS 2nd |
RIAS 1st |
| 2-B |
Corner |
Ticket Win |
128s |
100s |
115s |
107s |
The difference in times when using RIAS after the regular method was
highly significant (p<.017). There was no significant difference when
using RIAS first and then the regular method (p<.47). Overall,
the difference between the two conditions was not significant (p<.085).
Four subjects asked for help from others a total of four times when using their
regular method. No one using RIAS asked for help
|
Condition 1 |
Condition 2 |
| Task |
From |
To |
NRIAS 1st |
RIAS 2nd |
NRIAS 2nd |
RIAS 1st |
| 2-C |
Ticket Win |
Flowers |
93s |
15s |
45s |
21s |
The difference in times when using RIAS after the regular method was
highly significant (p<.0006). There was no significant difference
when using RIAS first and then the regular method (p<.069).
Overall, the difference between the two conditions was highly significant (p<.00006).
Seven out of 25 subjects asked for help from others a total of 11 times when
using their regular method. No one using RIAS asked for help.
|
Condition 1 |
Condition 2 |
| Task |
From |
To |
NRIAS 1st |
RIAS 2nd |
NRIAS 2nd |
RIAS 1st |
| 2-D |
Flowers |
Phone |
109s |
101s |
80s |
109s |
No significant difference was found for this task. Seven out of 25 subjects
asked for help from others a total of eight times when using their regular method.
No one using RIAS asked for help. In this location, the light
beam did not extend complexly to the adjacent wall, where most of the subjects
walked as they shorelined along the building wall, causing trouble in picking
up the signal easily.
|
Condition 1 |
Condition 2 |
| Task |
From |
To |
NRIAS 1st |
RIAS 2nd |
NRIAS 2nd |
RIAS 1st |
| 2-E |
Phone |
Track #2 |
172s |
86s |
107s |
85s |
The difference in times when using RIAS after the regular method was
highly significant (p<.0002). There was no significant difference
when using RIAS first and then the regular method (p<.14).
Overall, the difference between the two conditions was highly significant (p<.0001).
Seven out of 25 subjects asked for help from others a total of 12 times when
using their regular method. No one using RIAS asked for help.
Four people reported they were “not sure” they were at the correct
track when using their regular method. There was no Braille signage at
these doors, and, if people were not around to ask, blind people have no confirmation
of the correct location.
| |
Condition 1
|
Condition 2
|
|
NRIAS 1st
|
RIAS 2nd
|
NRIAS 2nd
|
RIAS 1st
|
|
Task #2 Total
|
574s
|
315s
|
421s
|
388s
|
The total of the five sub-tasks that make up Transfer Task 2 show how much better
people traveled when using RIAS. Once having used the system, their spatial
knowledge appeared to increase so that, on their second attempt using their
regular method, the results, although quicker in the RIAS condition,
are not significant (p<.14). When using their regular method of travel
first and then using RIAS, the results were highly significant (p<.00001).
The difference between the 30 trials with RIAS and the 25 trials
without RIAS was also highly significant (p<.0006). For the
25 subjects who attempted the 5 sub-tasks with their regular method, there were
a total of 17 tasks that they could not finish and were “timed out.”
The 30 subjects attempting the same five sub-tasks with RIAS only had three
that were “timed out.”
The order of the RIAS condition was shown not to be significant in this
task. Comparing RIAS 1 st to RIAS 2 nd
gives a value of (p<.35). This shows that the improvement in performance
when using the system is not due to the learning effect of a second trial.
Figure 3. 4 Excess Time using Regular Methods
and RIAS - Task 2
3.1.3.1.1. Flower Stand
The hardest location to find in the second transfer test was the flower concession,
which was located in the main area of the terminal. Subjects could not
find the counter, because flowerpots on the floor in front of the counter seemed
to obscure the counter. Subjects without the RIAS took 1063% extra time
over the FSU to find the counter. First attempts by those with RIAS
took only 162% more time than the FSU. Once they picked up the signal
and got positive identification, they knew to push forward through the scattered
flowerpots to the desired counter. Because of the blockage, this location
was categorized as another random or inconsistent amenity location with no cues.
The t-test statistics for the two conditions showed a significant difference
(P<.0007). For those subjects with no vision, t-tests showed a significant
difference (P<.0006).
3.1.3.1.2. Hard Street Crossing #2
The second crossing of King Street was in the opposite direction than the first
crossing. This direction, toward the Caltrain terminal, was even harder,
because the traffic turning right from 4th St. was across the street
and harder to hear and comprehend. This problem and the high speeds kept
some people from even attempting the crossing, and others took time to listen
to 2 or 3 signal cycles before crossing. The regular method subjects
took 504% longer than the baseline FSU. The RIAS gave a direct beam and
positive identification of the WALK signal and users with RIAS crossed this
street only 22% longer than the baseline FSU.
The t-test statistics for the two conditions showed a significant difference
(P<.005). For those subjects with no vision, t-tests showed a significant
difference (P<.007).
3.1.3.1.3. Train Track #2
The entrance doors to the boarding area for outbound trains had no Braille or
tactile information to identify the proper door. It took 454% longer
than the FSU to walk to, locate, and identify the proper door for those using
their regular method. The RIAS gave a direction beam and positive identification
of the track number, and those who used the system were only 176% longer than
the FSU.
The t-test statistics for the two conditions showed a significant difference
(P<.00004). For those subjects with no vision, t-tests showed a significant
difference (P< 0001).
3.1.3.1.4. Inside Phone
The phone bank in the terminal was located in the waiting room near the bathrooms.
Subjects had passed them on their first trip to the waiting room. There
are non-visual cues available if people are on the phone talking or coins are
heard. The RIAS signal at the waiting room was partially blocked by building
columns, and inside the room there were problems with many obstacles and crowds.
The excess times were quite similar at this location, with the regular
method subjects taking 289% longer and the RIAS users taking 290% longer than
the FSU. Since the subjects had been past this location previously and
there are other auditory cues, this amenity location was categorized as one
with good cues. The t-test statistics for the two conditions showed no
significant difference. For those subjects with no vision, t-tests also
showed no significant difference.
3.1.3.1.5. Ticket Window 1st time
The ticket window is rationally located directly inside the terminal.
For this test, the subjects walked back from the corner, retracing along the
curb to the building entrance. Subjects had passed this area previously,
there were usually lines of people queued up, and there were theatre-type
stanchions with ribbon-tape designating the waiting area. There were
also voices from the window agent and from people in line. Subjects
using their own aids took 125% longer, and those with RIAS took 88%
longer than the FSU. This location was categorized as an amenity with
good cues. There was no significant difference for the first attempt
in either the full all subjects and the no vision subjects’ data.
Figure 3. 5 Transfer Task 3 Path of
Travel
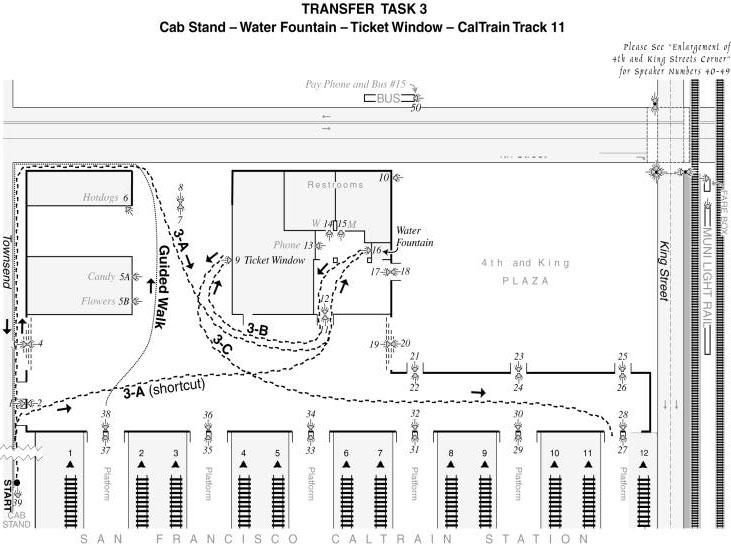
For this task, 15 subjects used their regular skills first for all three tasks
and then repeated the same tasks later using the RIAS. Fifteen subjects
used the RIAS for their first and only trial. They did not repeat
the experiment with their regular method.
|
Condition 1 |
Condition 2 |
| Task |
From |
To |
NRIAS 1st |
RIAS 2nd |
RIAS 1st |
| 3-A |
Taxi stand |
Water |
174s |
141s |
128s |
The water fountain was quite distant from the cab stand and was difficult to
locate in either condition for some subjects The difference in times when using
RIAS after the regular method was significant (p<.01). Overall,
the difference between the two conditions was significant (p<.045).
Without RIAS , seven out of 15 subjects asked for outside help a total
of 10 times. In this trial, subjects were told to find the water fountain,
with no mention of any specific path. They had previously been led out
the front entrance and around to the side of the terminal, never using the side
door (Townsend St). Six of the 15 NRIAS subjects (40%) made a
shortcut through the side door of the terminal. When using the RIAS
, 29 out of 30 subjects (97%) made a shortcut through the side door.
This was quite revealing, because many blind people have trouble making shortcuts
in an unknown space. Some of the subjects had some residual vision, but,
while using the RIAS, even the totally blind were able to understand the spatial
layout and find the side door entrance that they had never used. As shown
in Figure 3.5 , the side doors had identifying RIAS transmitters, and it appears
that although they did not use those doors previously, they must have learned
and stored that knowledge on the previous tasks.
|
Condition 1 |
Condition 2 |
| Task |
From |
To |
NRIAS 1st |
RIAS 2nd |
RIAS 1st |
| 3-B |
Water |
Ticket Win |
81s |
51s |
65s |
The results in the NRIAS 1 st condition were significant
(p<.02). In this sub-task, the results between the two conditions
were not significant (p<.09). Without RIAS, three out of 15
subjects asked for outside help. This was their second trip to the station
ticket window, and, by this time, it appeared that the subjects were learning
where it was located.
|
Condition 1 |
Condition 2 |
| Task |
From |
To |
NRIAS 1st |
RIAS 2nd |
RIAS 1st |
| 3-C |
Ticket Win |
Track #11 |
178s |
79s |
99s |
Track gate doors are not marked with Braille, and this door was at the far end
of the terminal where often there were no people to ask for help. People
with vision restrictions often rely on asking for help from others, but there
are many situations where few, if any, people are available for assistance.
This was certainly the case in this task. Six of fifteen people
without RIAS could not find the door in the four minutes allowed.
All 30 subjects using the RIAS found the correct track door. The results
for those who used the system second were highly significant (p<.00001),
and the overall results wee also highly significant (p<.000002).
In addition, over half (8/15) of the subjects not using the RIAS asked for outside
help a total of nine times. Three of the regular method users also reported
they were not sure if they were at the proper door, although they were actually
there.
|
Condition 1 |
Condition 2 |
| NRIAS 1st |
RIAS 2nd |
RIAS 1st |
| Task #3 Total |
433s |
272s |
302s |
For the entire trip from the cabstand to track 11, the results were highly significant
for both the NRIAS 1st – RIAS 2 nd
condition, and the overall average (p<.00002 and p<.002 respectively).
For the 15 subjects who attempted the three sub-tasks with their regular method,
there were a total of 11 tasks that they could not finish and were “timed
out.” The 30 subjects attempting the same three sub-tasks with
RIAS only had five that were “timed out.”
The order of the RIAS condition was shown not to be important in this
task. People performed just as well if they used the system first or
second. There was no significant difference based on order of use.
The t-test showed that (p<.3).
3.1.4.1. Time Penalties and Accessibility
Figure 3. 6 Excess Time using Regular Methods and RIAS - Task 3
Train Track #11
This door was located at the far end of the terminal where subjects had not
yet traveled. That area of the station was much less crowded and offered
fewer people to ask for help. Those subjects using their regular navigation
aids took 334% longer than the FSU. With RIAS, subjects could “see”
the door numbers as they walked down the hall and were able to keep going until
they found the proper door. Many subjects without the system were not
aware of how many gate doors were in the station and often stopped short.
Those using the RIAS were able to locate the proper door within a time
period that was 141% longer than the baseline.
The t-test statistics for the 2 conditions showed a significant difference (P<.0006).
For those subjects with no vision, t-tests showed a significant difference (P<.00002).
3.1.4.1.1. Ticket Window 2nd time
Regular method subjects took 307% longer, and RIAS subjects took
226% longer than the FSU baseline. No significant difference was found
for this task on the first trial.
3.1.4.1.2. Water Fountain
The water fountain was also located in the waiting room. Subjects
had been there twice before this sub-task. They could have found it
or heard cues on those trials. This location was classified as an amenity
with good cues. To get to the start location for this path, subjects
were guided out the main entrance and around the building. There was
a shortcut from the start point to the water fountain through side doors of
the terminal, which the subjects had not used before. The shortcuts
are discussed later (see Section 4.6.1 .
Spatial Knowledge Revealed by Navigation and Wayfinding Tasks ). For
the excess time comparison, and because the subjects had no previous knowledge
of the side doors, a comparison was made between these times and those of
the FSU taking the path subjects learned on their guided walk. Subjects
using their own aids took 117% longer and RIAS subjects took 73% longer
than the baseline. When subjects’ times are compared to the FSU
taking the shortcut, the regular aids subjects took 185% longer and the
RIAS subjects took 126% longer. The two conditions were almost
significant (P<.052) for the full group and not significant for those with
no vision.
3.1.5. Transfer Task 4: Track 11 to Bus Shelter Line #15
For this task, 15 subjects used their regular skills first for all three tasks
and then repeated the same tasks later using the RIAS. Fifteen
subjects used the RIAS for their first and only trial. They did
not repeat the experiment with their regular method.
|
Condition 1 |
Condition 2 |
| Task |
From |
To |
NRIAS 1st |
RIAS 2nd |
RIAS 1st |
| 4-A |
Track #11 |
Corner |
159s |
87s |
88s |
Significant performance differences were found both for the NRIAS 1st
condition and the average overall performance (p<.0003 and p<.0003 respectively).
In this walk, no specific route was mentioned; they were just told to
go to the corner that they had previously visited.
Figure 3. 7 Transfer Task 4 Path of
Travel
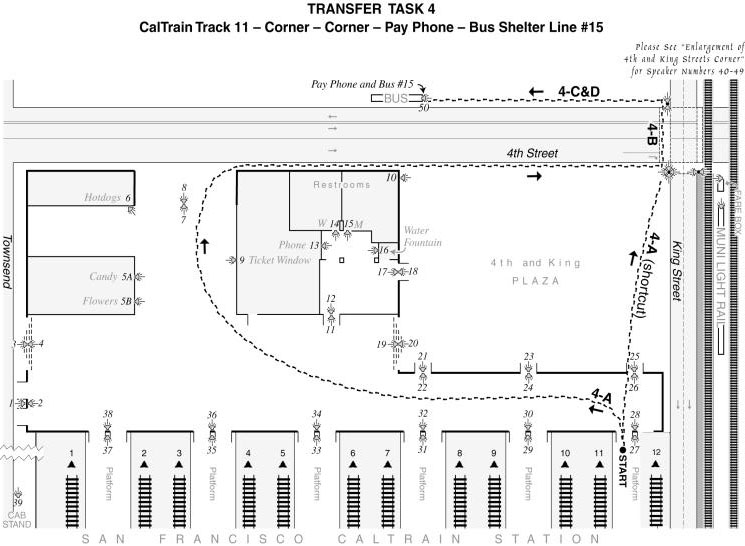
Previously, they had gone out the main entrance to reach this corner.
There were doors near the end of the station that would be a shortcut, although
they had never used them or been told about them. Three out of 15 (20%)
of those using their own methods were able to use this shortcut to the corner.
Those that used RIAS appear to have learned about the existence of
these doors while performing the previous task as 24 out of 30 (80%) were
able to find and use these side doors to make a shortcut to the corner.
Finding and using paths never used before is quite an accomplishment for many
blind people.
|
Condition 1 |
Condition 2 |
| Task |
From |
To |
NRIAS 1st |
RIAS 2nd |
RIAS 1st |
| 4-B |
Corner |
Corner |
24s |
16s |
15s |
This street crossing on 4th Street was not as difficult as the one
on King Street. The cars traveled much slower, and almost all made turns
in front of the pedestrian. Except for a one-lane bus route on the far
side, it was mostly a one-way street in front of the pedestrian. The
differences in performance were highly significant for both the NRIAS
1st condition (p<.001) and the RIAS versus NRIAS
results (p<.00005).
|
Condition 1 |
Condition 2 |
| Task |
From |
To |
NRIAS 1st |
RIAS 2nd |
RIAS 1st |
| 4-C |
Corner |
Pay Phone |
110s |
58s |
65s |
This task was made difficult by the fact that the pay phone was inside a glass-enclosed
bus shelter. There was no outside tactile evidence as to where it was
located. Significant performance differences were found both for the
NRIAS 1st condition and the overall performance of RIAS
versus NRIAS (p<.025 and p<.006, respectively). Two subjects
out of 15 in the NRIAS condition had to ask for help. Four out
of 15 subjects using their regular method “timed-out” and could
not find the phone. One person out of 30 using RIAS could not find the
phone.
|
Condition 1 |
Condition 2 |
| Task |
From |
To |
NRIAS 1st |
RIAS 2nd |
RIAS 1st |
| 4-D |
Pay Phone |
Bus Shelter |
71s |
0s |
0s |
The RIAS transmitter at this location identified both the phone and the fact
that it was a stop for the #15 bus line. Those without the system had
to continue their search to find the correct bus shelter. Seven of the
15 subjects using their normal skills had to ask others to get a positive identification
of the proper bus shelter. In addition, two subjects without the system
found the correct shelter but reported they “were not sure” if it
was for the correct bus line. All of the RIAS users knew they were already
at he bus shelter, and, therefore, no extra search time was needed.
|
Condition 1 |
Condition 2 |
| NRIAS 1st |
RIAS 2nd |
RIAS 1st |
| Tasks #4 Total |
364s |
161s |
168s |
For the entire trip from Caltrain track 11 to the bus shelter for line #15,
the results were highly significant for both the NRIAS 1st
– RIAS 2nd condition and the overall results (p<.00001
and p<.000002, respectively). For the 15 subjects who attempted the
four sub-tasks with their regular method, there were a total of 10 tasks that
they could not finish and were “timed out.” Of the 30 subjects
attempting the same four sub-tasks, only two were “timed out.”
The order of the RIAS condition was shown not to be important in this
task. People performed just as well if they used the system first or
second. There was no significant difference based on order of use.
The t-test showed (p< .43).
3.1.5.1. Time Penalties and Accessibility
3.1.5.1.1. Bus Stop for Route #15
The difficulty of finding bus stops has been confirmed in difficulty ratings
in this and previous studies. There is no consistent pattern of their
placement, and some are merely placed on pre-existing poles, such as streetlights.
Field tests have also showed how difficult these tasks are (Marston &
Golledge, 1998b) . Crandall et al. (1996) and Bentzen et al. (1999) found
that not one of their subjects could find a bus stop pole even when it had tactile
information about the stop. The bus shelter in this experiment had no
tactile information about which bus stopped there, and there was another shelter
nearby, further confusing the test subjects. The start point for this
task was adjacent to the shelter, but with no way to identify which bus stopped
there,
they had to search for help or other information. To avoid calculating
a penalty with a FSU user time of zero, four seconds was used to indicate the
time it took to move to the front of the bus shelter. It took 1685% longer
to find and identify the proper bus stop than the baseline FSU. With
RIAS, subjects knew exactly which bus stopped there, and all subjects completed
the task as fast as the FSU. The t-test statistics for the two conditions showed
a significant difference (P<.0009). For those subjects with no vision,
t-tests showed a significant difference (P<.006).
Figure 3. 8 Excess Time using Regular Methods and RIAS - Task 4
3.1.5.1.2. Outside Phone
The phone was located about half way down the street from the start point, and
those subjects who followed the curb could run into it. There was a wastebasket
in front of the phone, and this obstacle slowed many people. The subjects
that used their normal aids took 289% longer than the FSU, and those who used
RIAS took 137% longer. Unlike the phone in the terminal, subjects had
not been to this location previously and there was never anyone using it to
give auditory cues. Therefore, this amenity was categorized as one with
few cues.
The t-test statistics for the two conditions showed a significant difference
(P<.029). For those subjects with no vision, t-tests showed a significant
difference (P<.003).
3.1.5.1.3. Walk to Corner #2
Subjects were asked to walk to the first corner that they had visited in the
experiment. Although finding information about the street corner might
be quite difficult, the task of finding a corner is something in which most
blind people are well trained. Subjects made previous trips to the corner
by going out the main exit of the terminal. There were some side doors
that allowed a short cut to the location. Because the subjects had never
used that route, their time was compared to the FSU taking the longer but familiar
route. For the subjects who used their regular navigation aids, it took
them 78% longer than the FSU. Users of RIAS were usually able to detect
the doors for the shortcut, and their average time was equal to that of the
FSU taking the longer route. If subjects’ times are compared to
the FSU taking the shortcut, the regular aids subjects took 429% longer and
the RIAS subjects took 200% longer (see
Section 4.6.1 , Spatial Knowledge Revealed by Navigation and Wayfinding
Tasks for more information about making shortcuts).
The t-test statistics for the two conditions showed a significant difference
(P<.001). For those subjects with no vision, t-tests showed a significant
difference (P<.02).
3.1.5.1.4. Medium Difficulty City Street #1
Crossing 4th Street was much easier than King Street. On the
north side was a one-lane dedicated bus lane, which was usually vacant.
The south had two lanes with a third turn lane at the corner. This was
a much more typical congested city street, with cars parked in front of the
terminal. The block was quite short and also had a traffic signal at
the other end, so there was no high-speed traffic. Because of the bus
lane, there were no vehicles turning onto the street, and few cars went straight
across King. Most cars turned right at the terminal. It took the
subjects with their regular navigation 58% longer than the FSU. Subjects
using RIAS took, on average, no longer than the FSU.
The t-test statistics for the two conditions showed a significant difference
(P<.0006). For those subjects with no vision, t-tests showed a significant
difference (P<.001).
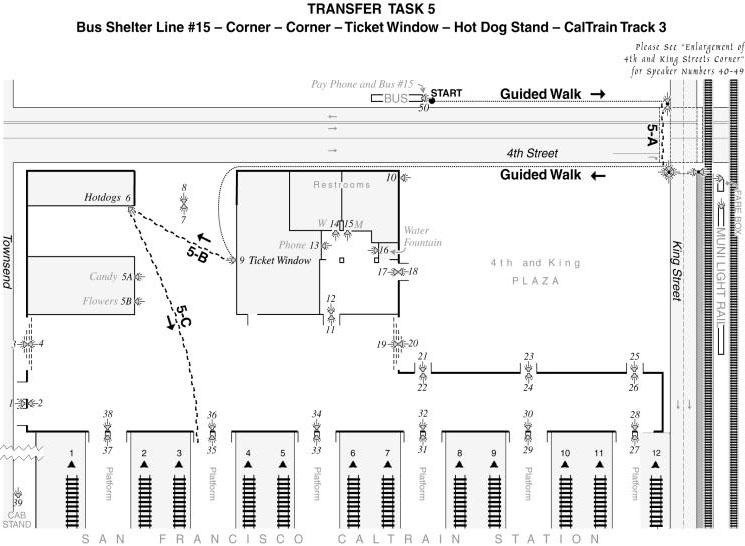
Figure 3. 9 Transfer Task 5 Path of Travel
For this task, 15 subjects used their regular skills first for all three tasks
and then repeated the same tasks later using the RIAS. Fifteen subjects
used the RIAS for their first and only trial. They did not repeat
the experiment with their regular method.
Bus Shelter #15 – Corner = Guided Walk
|
Condition 1 |
Condition 2 |
| Task |
From |
To |
NRIAS 1st |
RIAS 2nd |
RIAS 1st |
| 5-A |
Corner |
Corner |
23s |
16s |
15s |
The street crossing on 4th Street was not as difficult as the one
on King Street. The cars traveled much slower, and all traffic, except
for buses, was in one direction. Therefore, it was much easier to hear
when the cars stopped. The differences in performance were highly significant
for both the NRIAS 1st condition and the overall performance
of RIAS versus NRIAS (p<.001 and p<.0001, respectively).
The RIAS gave immediate confirmation that it was safe to cross the street and
also gave a directional beam to follow in order to stay in the crosswalk.
One subject without the RIAS made an unsafe attempt to cross the street.
Corner – Ticket Window = Guided Walk
|
Condition 1 |
Condition 2 |
| Task |
From |
To |
NRIAS 1st |
RIAS 2nd |
RIAS 1st |
| 5-B |
Ticket Window |
Hot Dog Stand |
73s |
26s |
34s |
The differences in performance were highly significant for both the NRIAS
1st condition and the overall performance (p<.004 and p<.0004,
respectively). Seven subjects without the RIAS asked for outside help
a total of 10 times.
|
Condition 1 |
Condition 2 |
| Task |
From |
To |
NRIAS 1st |
RIAS 2nd |
RIAS 1st |
| 5-C |
Hot Dog |
Track #3 |
126s |
63s |
60s |
Because there were no accessible signs on the track doors, it was difficult
to find the correct track. Six subjects using their normal skills had
to ask for outside help a total of nine times. Again, both the NRIAS
1st condition and the overall performance using RIAS were
significant (p<.004 and p<.0002, respectively).
|
Condition 1 |
Condition 2 |
| NRIAS 1st |
RIAS 2nd |
RIAS 1st |
| Task #5 Total |
222s |
105s |
109s |
For the entire trip from the #15 bus shelter to Caltrain track 3, the results
were highly significant for both the NRIAS 1st - RIAS
2nd condition and the overall performance (p<.0003 and
p<.00002, respectively). For the 15 subjects who attempted the five
sub-tasks with their regular method, there were a total of five tasks that they
could not finish and were “timed out.” The 30 subjects attempting
the same sub-tasks with RIAS had no tasks that were “timed out.”
The order of the RIAS condition was again shown not to be important
in this task. People performed just as well if they used the system first
or second. There was no significant difference based on order of use.
The t-test showed (p<.43).
3.1.6.1. Time Penalties and Accessibility
Figure 3. 10 Excess Time using Regular Methods and RIAS - Task 5
3.1.6.1.1. Track Door #3
In their third and final attempt to find one of the track doors, subjects walked
from the hot dog stand to track #3. Finding this unlabeled door took
498% longer than the baseline time. For those who used RIAS, it took
them 186% longer. There was a significant difference between the first-time
attempts (P<.003). For those with no vision, the results were also
significant (P<.005).
3.1.6.1.2. Hot Dog Concession
It was a short walk from the ticket window to the hot dog area, but it was placed
so close to the front exit that it seemed to confuse the subjects. It
was about 15’ from the other two concessions that they had visited.
It took the subjects using their normal navigation aids 462% longer than the
FSU baseline, and the subjects who used RIAS took only 160% longer. At
times there were voices at the counter to give some cues, so this amenity was
categorized as one with few cues.
The t-test statistics for the two conditions showed a significant difference
(P<.01). For those subjects with no vision, t-tests showed a significant
difference (P<.01).
3.1.6.1.3. Medium Difficulty City Street #2
Walking south across 4th Street was a bit harder than going the other
direction. The turn lanes were at the opposite side of the street; so
auditory cues from the street were a bit harder to pick up than when the right
turns and traffic were directly in front of the subjects. Those subjects
who used their regular navigation skills took 67% longer, and the RIAS users
took only 6% longer than the FSU baseline.
The t-test statistics for the two conditions showed a significant difference
(P<.002). For those subjects with no vision, t-tests showed a significant
difference (P<.0004).
3.1.7. Totals for all Five Transfer Tasks
The degree of efficacy when using RIAS to enable blind and vision-impaired
travelers to navigate in large and confusing urban transit environments has
been shown here to be highly significant, and system use adds to safety, speed,
and spatial knowledge. The results of the five transfer tasks show
that this type of system is very beneficial to blind travelers. The
total times for the five tasks are shown below. This might represent
a normal day for a person making five transfers to different modes.
The ability to travel with increased efficiency in a timely and direct manner,
complete more tasks, not having to locate people and ask for help, and being
able to easily and safely cross busy streets gives people with vision impairments
a much better chance to access and use the urban environment. It allows
them to achieve more equal access to transit and public buildings in a safe,
dignified, and independent manner.
3.1.7.1. Total Travel Task Time
|
Condition 1 |
Condition 2 |
| NRIAS 1st |
RIAS 2nd |
RIAS 1st |
| All 5 Tasks Total |
2189s |
1129s |
1261s |
For the 15 subjects who completed all five transfer tasks using NRIAS
1st and RIAS 2nd, the results were highly significant
(p<.0000002). The average time for NRIAS 1st
was about 36 minutes, and the time fell to 19 minutes with RIAS.
All 15 subjects who tried their regular methods first ( NRIAS ) saved
time when they tried RIAS 2nd, but RIAS helped the slower test subjects
the most. One subject saved 28 minutes and two saved 27 minutes.
For the fastest subjects, who all had the ability to see objects, and did not
use a mobility aid,RIAS helped reduce their time by one, six, and eight minutes.
Data points were plotted for each subject, with their NRIAS 1st
value and their RIAS 2nd value. A regression line of
best fit showed a high correlation effect of R2 =.73. When
one subject was removed from the analysis because of very inferior navigation
skills, the results for the remaining 14 subjects showed a value of R2
= .85, indicating a fairly constant effect. They all saved time with
RIAS but the high R2 value showed that users were consistently slow
or fast, relative to the condition mean, whether they used RIAS or NRIAS.
The benefits of RIAS appears so powerful that there is no significant difference
between those that used the system for their first trail and those that had
first tried the tasks on their own and then tried the experiment again with
the RIAS. The t-test value showed that the order was not significant
(p<.25).
People found locations quicker and missed them less often when using RIAS them
when using their regular methods. This was achieved with only 10 to 15
minutes of training. Street crossing results showed that, without the
system, many people made potentially fatal decisions and that there was much
hesitation and even some refusals to cross dangerous streets. In all,
subjects using their own skills made 38 attempts to cross the street when it
was unsafe to do so.
These five tasks were designed to approximate a typical day’s transfer
tasks for a daily urban traveler. The travel times for the RIAS
1st condition was fully 39% less than for those using NRIAS
first. When those using NRIAS first tried the RIAS, their times
fell, on average, by 49%. This is a tremendous saving in effort and personal
stress. The times would certainly drop even more with repetition and
learning. But even in a novel environment, the ability to save 49% of
the normal time of these tasks, and the increased completion rate, are a great
incentive for more and safer travel.
A sighted research assistant (FTSU) who had never been to the site received
the same instructions, and it took him 9.47 minutes to complete the route on
his first attempt (see Section 1.6.6 , Sighted
Subjects for Baseline ). The 15 vision-impaired subjects who tried their
regular method first took, on average, 36.48 minutes. The time “penalty”
for vision loss was thus 3.85 times more effort than for the sighted.
This penalty shows that to date there is no “equal access” to transit.
The average time for those who used RIAS first was 22.13 minutes.
Their penalty fell to a more tolerable and equitable 2.34 times the time
for the sighted.
There was a wide range of subjects with various skills and degrees of vision
loss. If only the top performers on these transfer tasks are compared,
some very revealing evidence for RIAS is uncovered. Of those 15 that used
RIAS first, six (40%) had times that were less than twice as long as
the FTSU baseline data. The best time was only 9% longer than the baseline,
with the next five having times of 21%, 24%, 67%, 85%, and 88% longer.
That is certainly more like the reasonable accommodations and equity that is
the focus of the ADA. When the results of those vision-impaired people
who used RIAS for their second trial are compared against a fully sighted
first-time person, the results are even more powerful. Nine of 15 subjects
(60%) had times within twice that of the sighted baseline. One person
actually completed the task 1% faster than the sighted subject. The next
lowest eight times were 7%, 30%, 31%, 33%, 41%, 51%, 57%, and 68% longer.
The possible savings of so much time, effort, and stress shows that the ability
to identify locations and access directional cues is quite helpful in providing
increased access to transit and public buildings for the vision-impaired.
3.1.8. Unsafe Attempts to Cross Street
Street crossing can be very unsafe for a blind pedestrian. With proper
training, this group can perform amazing and fearless (to the sighted) feats
of mobility. However, many intersections are not easy to cross.
Irregular angles of intersection, and configuration and timing of turn lanes
and traffic flow can make many intersections quite difficult. In the
NRIAS condition, subjects crossed streets 80 times and made 38 unsafe
(48%) attempts to cross those streets while the WAIT light was on and traffic
had the right-of-way. At the most dangerous crossing, Task 2-A, three
subjects waited their full four minutes and did not cross the two-lane street.
If there had been no researcher watching for traffic or helping them
across, this one intersection bottleneck could have completely halted any
further travel progress or resulted in bodily harm. At this same intersection,
fully 13 of 25 subjects (52%) attempted unsafe crossings with their regular
method a total of 20 times. In addition, 17 out of 80 (21%) attempts
to cross missed the opposite curb, also putting them in danger. When
using RIAS, not one unsafe attempt was made to cross the street, because the
receiver told them the status of the WALK and WAIT signal. Only one
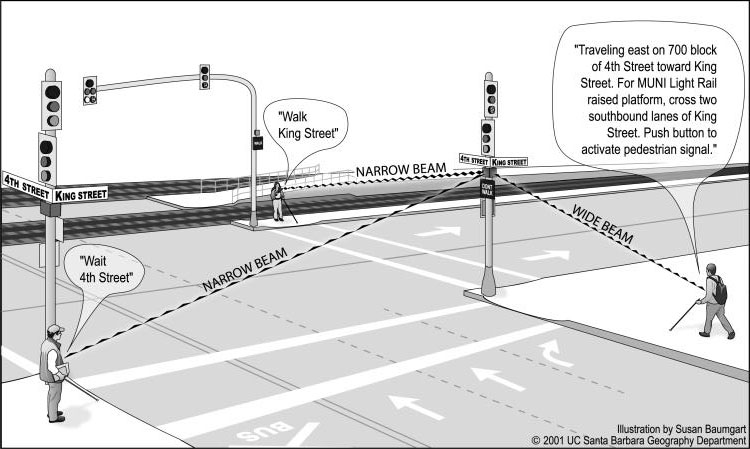
person using RIAS missed the opposite corner. Figure 3.11 shows the
wide and narrow beams at the intersection that give the traveler both street
information and specific information about the phase of the WALK signal and
other interaction information. Independence, environmental information,
and trip making enhancements are wonderful outcomes from using RIAS, but the
safety of the blind pedestrian is a major benefit of this system.
Figure 3. 11 Oblique View of RIAS Installation at King
and 4th Streets
Often, the only way a vision-impaired person can navigate about an environment
is to search for a sighted person and then ask for help. This makes
some people feel vulnerable and dependent on others. Many objects in
the environment are not marked in any fashion, and, without vision, there
is no way to differentiate objects such as a bank of doors. Often there
are few, if any, people around to ask, and some of them might not know the
answer, refuse to help, or be unable to speak the same language. Fear
of personal assault makes some people want to avoid drawing any undue attention
to their vulnerability as a blind person. These fears are yet another
factor that might keep people from making the trips they desire and might
negatively impact their ability to enjoy full and active travel and activity
participation. Many subjects in this experiment, when using their regular
method of travel, had to ask people for help, and often there was no feedback
to help identify locations.
- There were 75 sub-tasks for the NRIAS 1 st condition
in Task 1 and these subjects asked for assistance from others 23 times (31%)
of the time.
- There were 75 sub-tasks for the NRIAS 1 st condition
in Task 2 and these subjects asked for assistance from others 35 times (47%)
of the time.
- There were 45 sub-tasks for the NRIAS 1 st condition
in Task 3 and these subjects asked for assistance from others 22 times (49%)
of the time.
- There were 60 sub-tasks for the NRIAS 1 st condition
in Task 4 and these subjects asked for assistance from others 9 times (15%)
of the time.
- There were 45 sub-tasks for the NRIAS 1 st condition
in Task 5 and these subjects asked for assistance from others 18 times (40%)
of the time.
Since subjects knew this was a test and that the researcher was with them,
they must have felt safer than if they were truly on their own. In
a real situation, some of these people would have probably not bothered to
risk their safety and ask for help, giving up on the task instead.
When subjects used the RIAS, not one person asked for help. In fact,
two people were offered help by strangers and they politely refused, not needing
any assistance. What is even more revealing is the fact that, for those
who tried RIAS first and then used their regular method, there were
only three requests for assistance out of 100 sub-tasks (3%). Having
found the locations first using RIAS, many questions of identity or
location had already been answered. These data indicate how dependent a blind
traveler is on other people and how vulnerable thez might be in an urban environment.
Having to rely on others for simple verification of objects and directions
can be a heavy penalty to pay. This reliance on others contradicts
attempts to promote access or independence.