BASIC CONCEPTS OF GIS
Michael
F. Goodchild
UC Santa Barbara
OUTLINE
5.
THE NATURE OF GEOGRAPHIC INFORMATION
Geographic information
information about some place on the surface of the EarthThe Internetor near the surfaceone of the earliest forms of shared informationat some point in time
hunters and gatherers reporting back to the bandstoring on paper"there's good hunting near the old tree"
early stick maps for navigation in the Pacific
drawings on cave walls
the printing press in the 15th Centuryinformation accessible to all
shared knowledge as a human community asset
Prince Henry the Navigator, 1394-1460
massive new capability for sharing, communicating geographic informationin digital form
paradigm changefrom GIS as the personal engine performing calculations on datahumans work in a vague worldto GIS as the medium for communicating knowledge of the planet
GIS as a precise medium acts as a filter
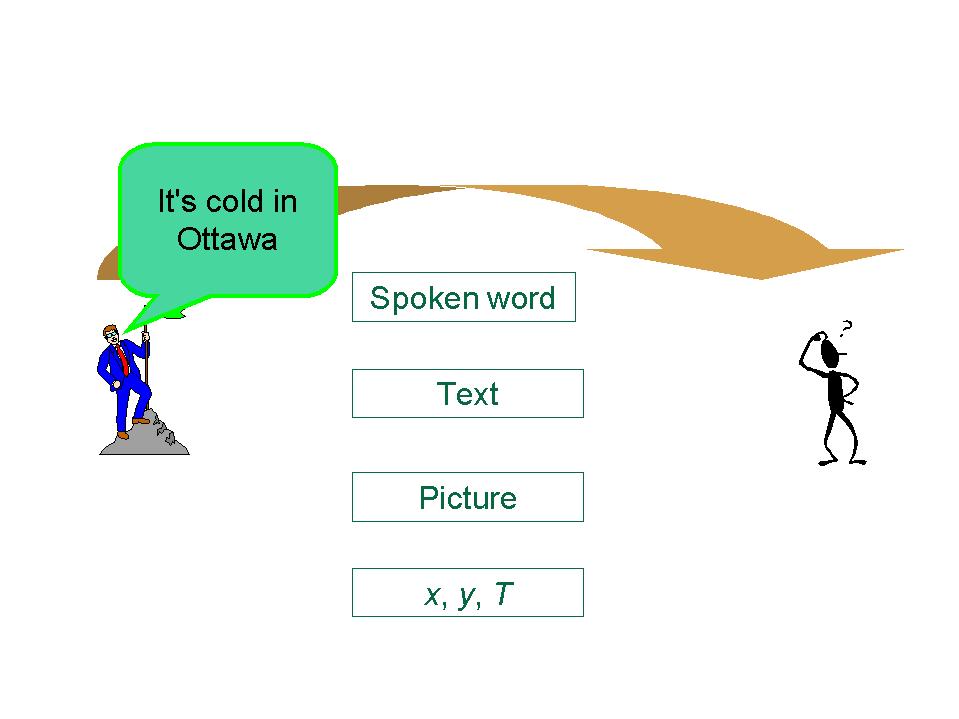
The atom of geographic information
<location, time, attribute>Suppose we could capture it allit's cold today in Ottawageneral methods for describing locationat 45 North, 75 East at 12 noon EST the temperature was -10 Celsius
everyone around the world understands latitude and longitudeattributes must also be generally understoodsimilarly for time
"cold" is subjective and relative-10 Celsius is generally understood
complete representation of the planetAl Gore's dream of a Digital Earthpast, present, and future
a "mirror world"
“Imagine, for example, a young child going to a
Digital
Earth exhibit at a local museum. After donning
a head-mounted display, she sees Earth as it appears
from space. Using a data glove, she zooms in,
using higher and higher levels of resolution, to see
continents, then regions, countries, cities, and
finally individual houses, trees, and other natural and
man-made objects. Having found an area of the
planet she is interested in exploring, she takes the
equivalent of a ‘magic carpet ride’ through a 3-D
visualization of the terrain. Of course, terrain is
only
one of the numerous kinds of data with which she
can interact. Using the system’s voice recognition
capabilities,
she is able to request information on
land cover, distribution of plant and animal species,
real-time weather, roads, political boundaries, and
population. She can also visualize the environmental
information that she and other students all over
the world have collected as part of the GLOBE project.
This information can be seamlessly fused with
the digital map or terrain data. She can get more
information
on many of the objects she sees by using
her data glove to click on a hyperlink. To prepare for
her family’s vacation to Yellowstone National
Park, for example, she plans the perfect hike to the
geysers, bison, and bighorn sheep that she has just
read about. In fact, she can follow the trail visually
from start to finish before she ever leaves the
museum in her hometown.
She is not limited to moving through space, but can
also
travel through time. After taking a virtual
field-trip to Paris to visit the Louvre, she moves
backward
in time to learn about French history,
perusing digitized maps overlaid on the surface of the
Digital Earth, newsreel footage, oral history,
newspapers and other primary sources. She sends some
of this information to her personal e-mail
address to study later. The time-line, which stretches
off in the distance, can be set for days, years,
centuries, or even geological epochs, for those
occasions
when she wants to learn more about
dinosaurs.” (U.S. Vice President Al Gore, in a speech
written for presentation at the California Science
Museum, Los Angeles, January 1998)
How many atoms are there?
an infinite numberReduce the level of detail, aggregate, generalize, approximateto make a two-word description of every sq km on the planet would require 10 Gigabytes
to store one number for every sq m on the planet would require 1 Petabyte
that's too many for any system
how to limit?
ignore the waterThe problemthat's 2/3 of the planetone temperature for all of Ottawaone number for an entire areasample the spacedefinition of the area is shared and implicit
definition of the area is finite and digital
only measure at weather stationsall geographic data miss detailbecause temperature varies slowly
all are uncertain to some degreeall geographic phenomena vary slowly
there are many ways of doing thisa GIS user must make choices
GIS designers must allow for many options
geographic description is complex
description of the differences between a representation and the truth can be as important as the representation
need to know what is missinge.g. a space-time representationthe uncertainty about reality associated with a representation
The most important of the options
how we think about the worldDiscrete objectshow we interpret the contents of a database
not inherent in the database
points, lines, areas (or volumes) having known propertiesFieldslittering an otherwise empty space
may overlap
can be counted
how many lakes are there in Minnesota?represent as shapefileshow many mountains in Scotland over 3000 ft?
how many clouds in the sky?
how many cities over 1 million population?
how many atmospheric lows in the northern hemisphere today?
pointspolylines
polygons
things it's worth measuring at every location on the planetLakes in Minnesotatemperaturepopulation densitysoil pH
soil type
land cover type
elevation
source of language, metaphorrainfalldid Newton, Leibnitz think that way?
ownership
explicit scale (property of convolution)each of these variables has one value everywherevariable is a function of location
field = a way of conceiving of geography as a set of variables each having one value at every location on the planet
z = f(x,y,z,t)six alternative representations:a raster of pointssample points (weather stations)
a triangulated irregular network
a raster of cells
a coverage
contours
how many are there?Weather forecasting
fronts, highs, lows, or pressure surfaces?Objects are intuitive, part of everyday life
fields are more associated with scienceBoth objects and fields can be represented either in raster or in vector form
two point-data sets
Discrete object implementations
shapefilesSix types of shapefilesArcViewcollections of points, lines, and areas
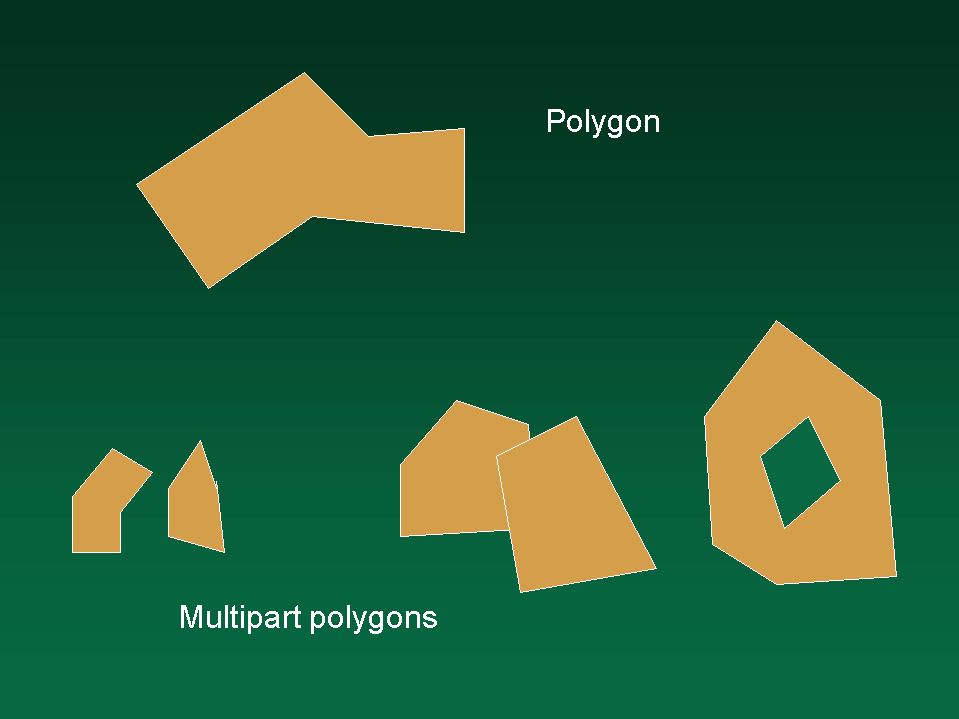
pointField implementationsmultipointpolylinea line made by connecting points with straight linespolygonmultipart polyline
an area made by connecting points with straight linesslidemultipart polygon
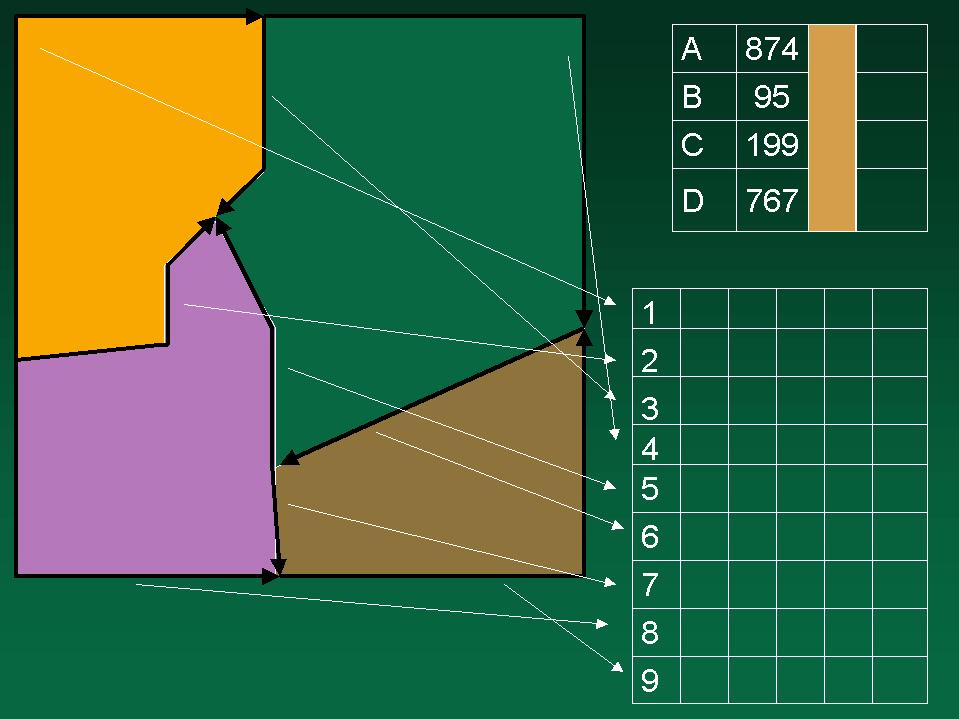
coveragesComponents:the relational model applied to GIS
the georelational modelrepresenting maps in the relational model
ARC/INFO circa 1980
polygonsUsing arcs as the basic unitarcs
nodes
avoids double representation of internal boundariesDistinct behavior of shapefiles and coverageseasier to build the databaseeasier to edit and maintain
keeps track of 'topology'
which nodes are connected by which arcswhich polygons are separated by which arcs
Data that fit the coverage model
all points within one polygon have the same attributesall points must lie in exactly one polygon
resource management
forest standsthe cadastersoil type
soil mapvegetation cover classland use class
land ownership parcelsdemographicscensus datathe choropleth mapdata by state
data by county
marketing data by market area
population by ZIP
the area class map
coverages capture the field view of the world
a continuous worldone value of a variable at every point
sharp changes in value as
boundaries are crossed
points5. THE NATURE OF GEOGRAPHIC INFORMATIONlines
arcsTINsgrids