Methods for working with spatial data
to detect patterns, anomaliesMethods for adding value to datato find answers to questions
to test or confirm theories (deductive reasoning)
to generate new theories and generalizations (inductive reasoning)
grounded in fundamental spatial concepts
pattern, cluster
anomaly
location, distance, shape
watershed, stream network
viewshed
what we think about when using GIS to analyze data
scale
uncertaint
see teachspatial.org
in doing scientific researchA collaboration between human and machinein trying to convince others
the machine does things the human finds too tedious, difficult, complex to do by handRanging from simple to complexthe human directs, makes interpretations and inferences
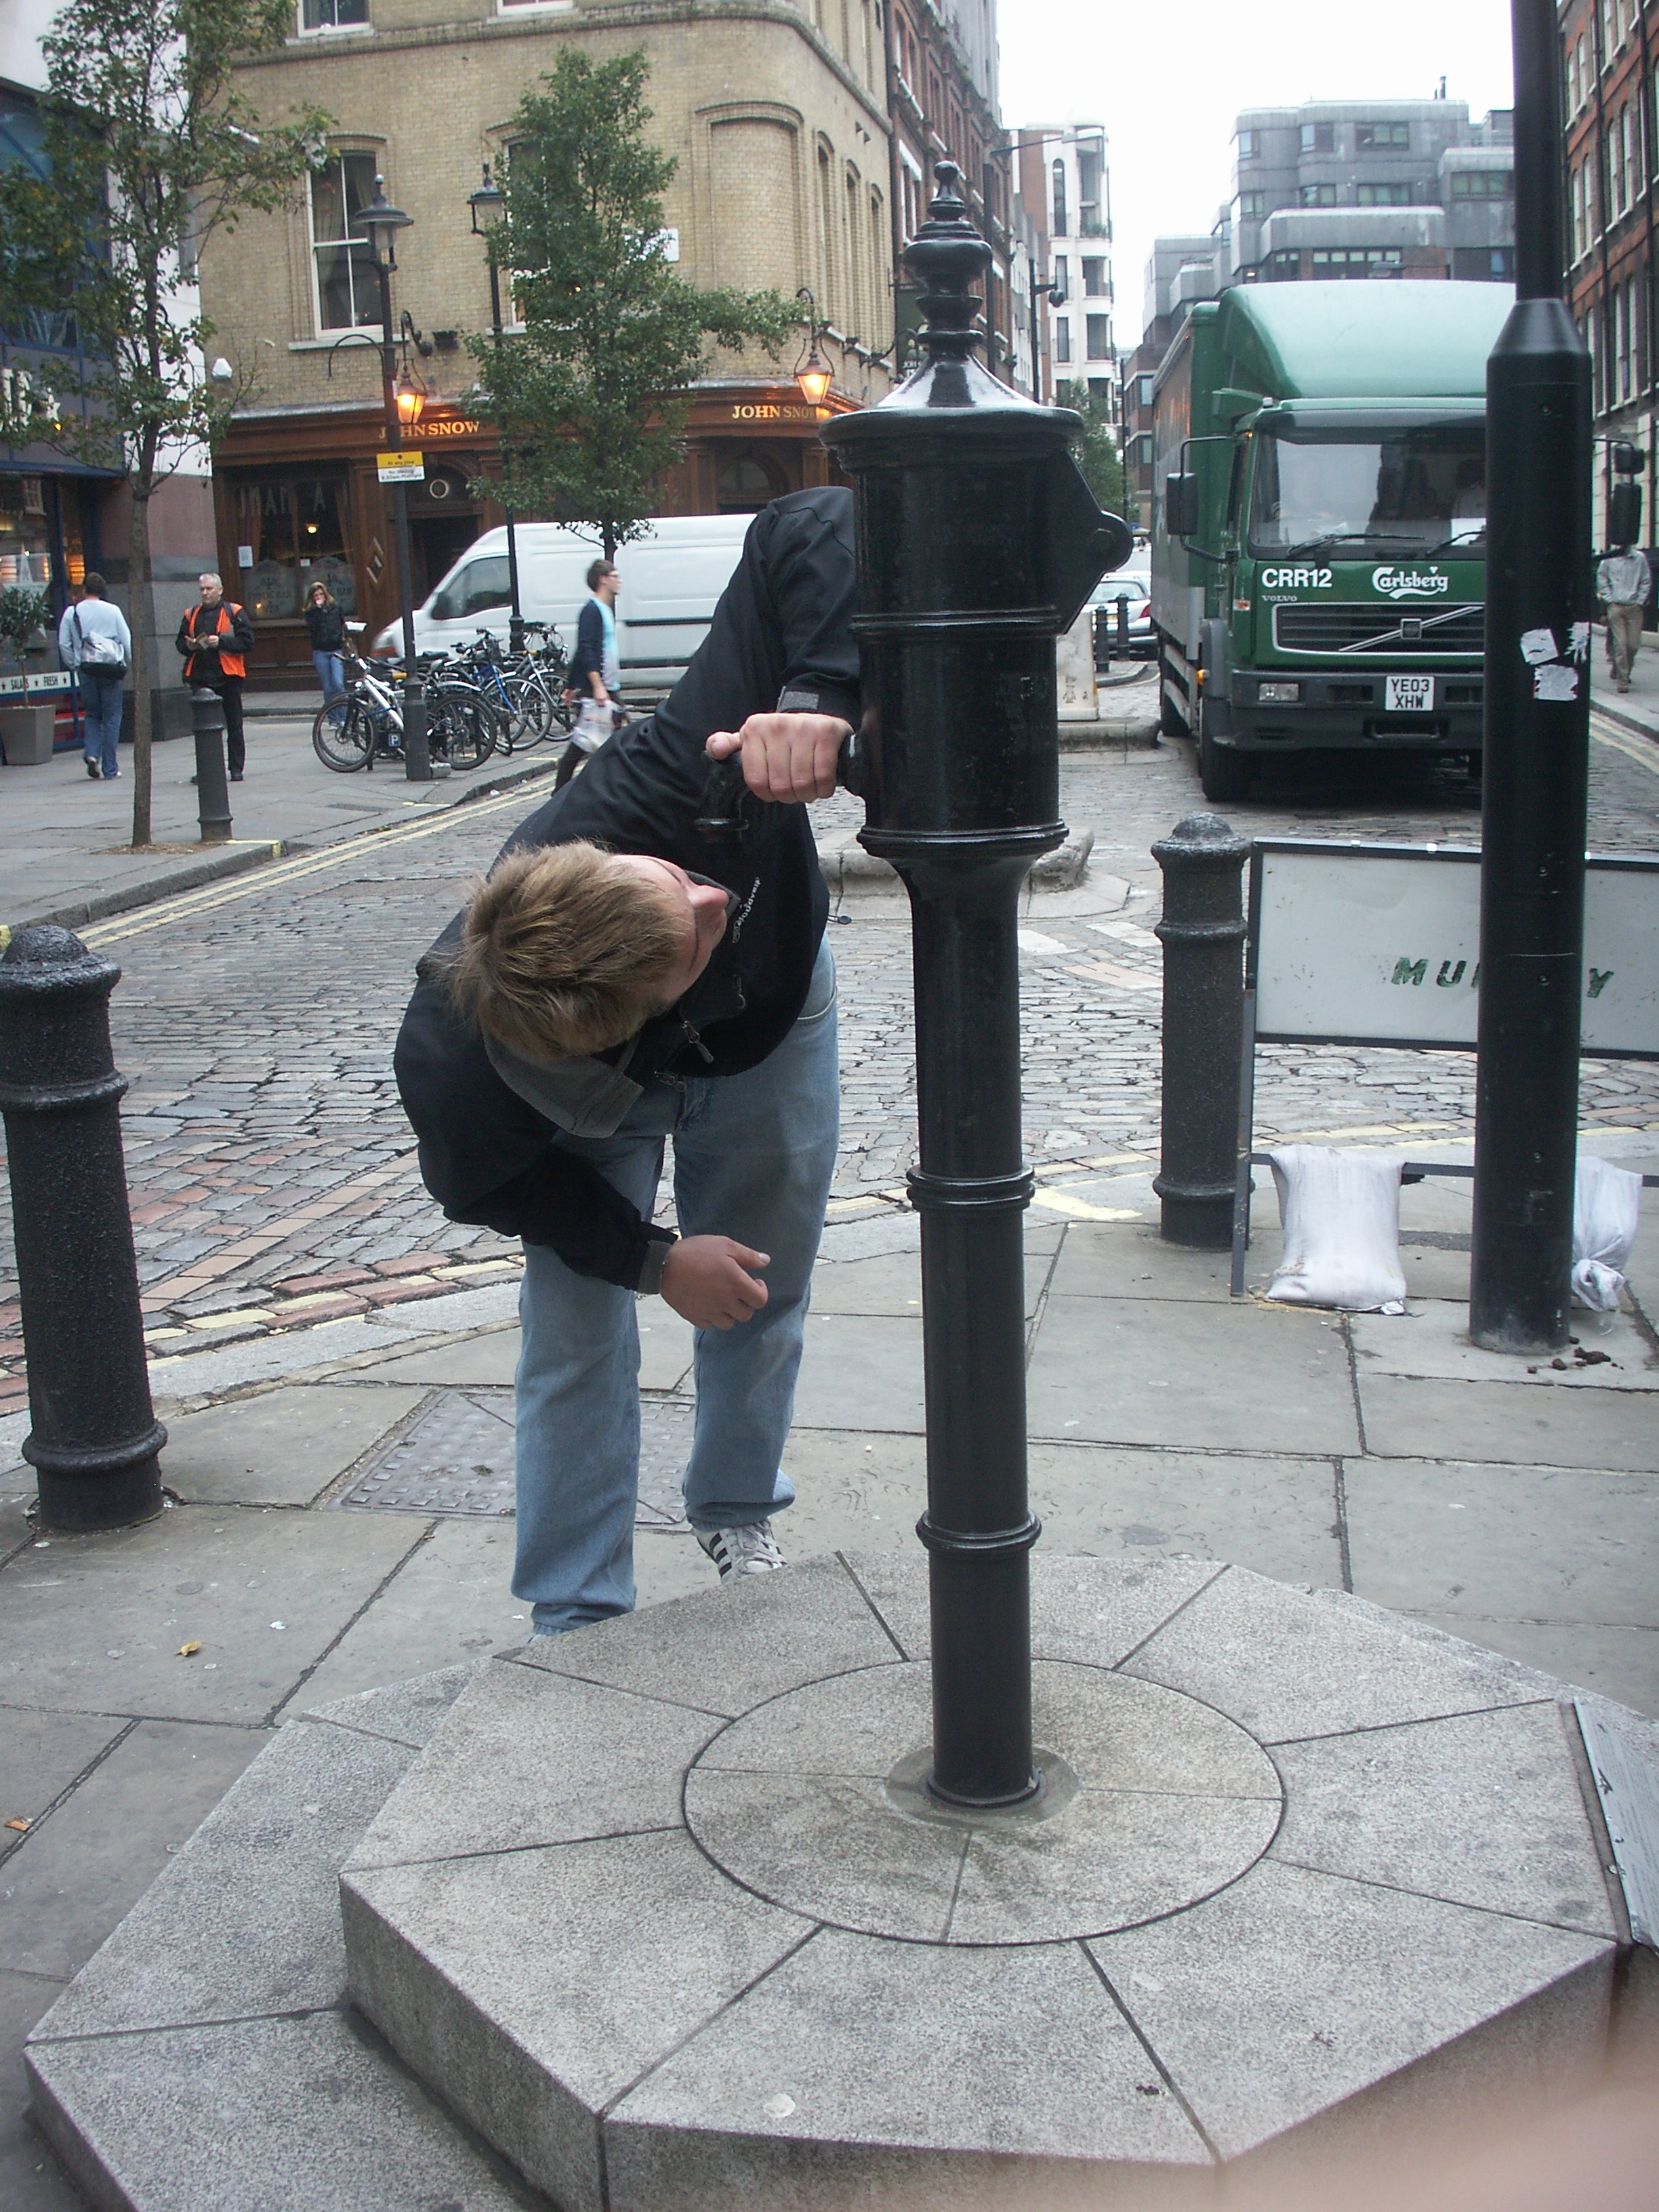
some methods are mathematically sophisticatedThe Snow mape.g. statistical testsother methods are visual, intuitive, simplemaking and examining maps
cholera outbreak in Soho, 1854Dr John Snow and the pump
inference regarding the transmission mechanism for cholera
see www.jsi.com
updating Snow
Openshaw's map of childhood leukemia in N England
Basic spatial concepts
lie behind every type of spatial analysis
fundamental ideas about how the geographic world is structured
Types of spatial analysis
data typesAttribute typesapplication domainsdiscrete objects (points, lines, areas)
continuous fields
spatially intensive, spatially extensive
nominal, ordinal, interval, ratio, cyclic attributes
objectives
nominalSix distinct objectivese.g. vegetation classordinal
no implied order, no arithmetic operations
no average
"central" value is the commonest class (mode)e.g. ranking from best to worstinterval
implied order, but no arithmetic operations
no average
"central" value has half of cases above, half below (median)e.g. Fahrenheit temperatureratio
differences make sense
arbitrary zero point
"central" value is the meane.g. weightcyclic
ratios make sense
absolute zero point
"central" value is the meanscale repeats itself
e.g. aspect
be careful with arithmeticaverage of 1 and 359 is 180
queries and reasoningmeasurements
transformations
descriptive summaries
optimization
hypothesis testing
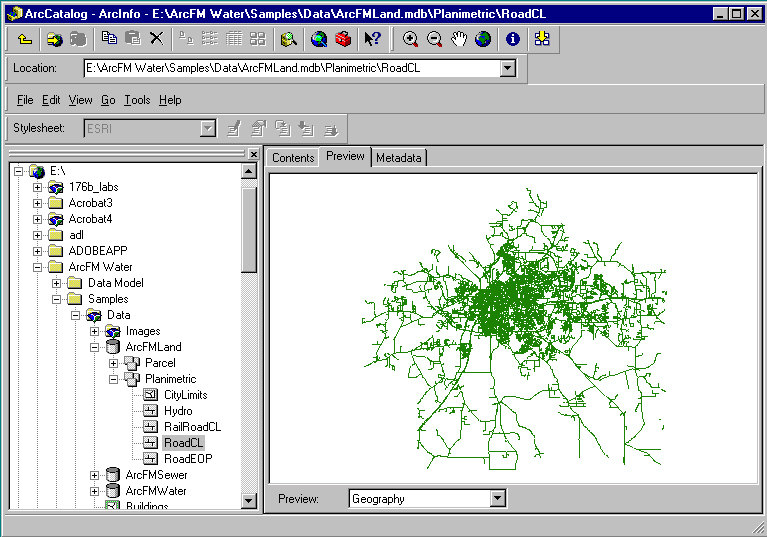
A GIS can present several distinct views
each view can be used to answer simple queriesIn ArcCatalog
hierarchy of devices, folders, datasets, filesIn ArcMap
map
table
metadata
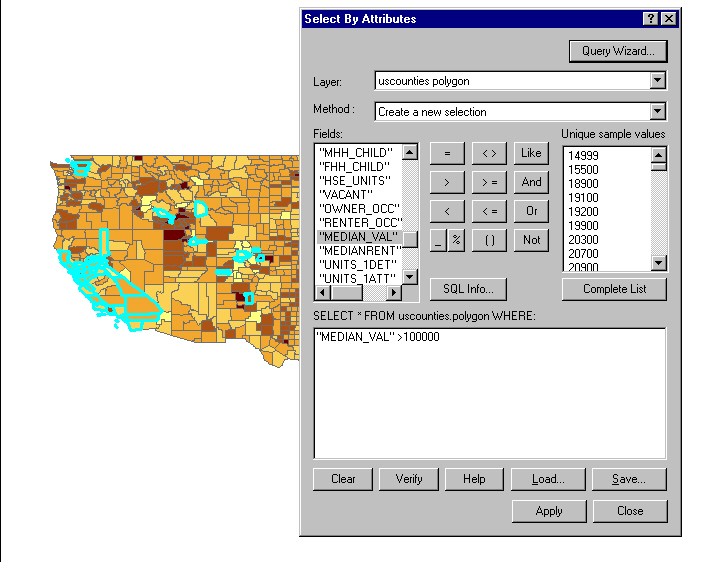
map viewExploratory spatial data analysis
table viewlinked viewshistogram view
scatterplot viewpercent owner occupied against median value by county
interactive methods to explore spatial dataSQLuse of linked views
finding anomalies
mining large masses of datae.g. credit card companies
anomalous behavior in space and time
structured or standard query language
We spend our lives in the vague world of human discourse
"is Santa Barbara north of LA?"a GIS needs to know exactly what is meant by "north of"is Reno east or west of San Diego?we tend to think of the US as a square, with two N-S coastshow to design a GIS to provide driving directions?to direct people through airports?a GIS would be easier to use if could "think" and "talk" more like humansor if there could be smooth transitions between our vague world and its precise worldin our vague world, terms like "north of" are context-specificgeographically relevant terms like "across" or "in" have many meanings
spatial analysis is built on a formal, precise model of the world
not the comparatively vague, intuitive human view
Measurements are often difficult to make by hand from maps
measuring the length of a complex featureDistance and length
measuring areahow did we measure area before GIS?
calculation from metric coordinatesLength of a complex objectstraight-line distance on a plane
Pythagorean distancedistance on a spherical Earthd = sqrt ((x1-x2)2+(y1-y2)2)
from (lat1,long1) to (lat2,long2)
R is the radius of the Earth, roughly 6378 kmd = R arccos [sin lat1 sin lat2 + cos lat1 cos lat2 cos (long1 - long2)]
add the lengths of polyline or polygon segmentsTwo types of distortions
if segments are straight, length will be underestimated in generalAreafor lines and areaslengths are measured in the horizontal planeunderestimated in hilly areasapplies to surveyed land also
how to measure area of a polygon?Shapeproceed in clockwise direction around the polygon
for each segmentan example of an algorithmdrop perpendiculars to the x axisat the end, the sum will be the area of the polygon
this constructs a trapezium
compute the area of the trapeziumdifference in x times average of ykeep a cumulative sum of areasa set of rules executed in sequence to solve a problemwhen might the algorithm fail?
executed in this case in a GISislands must all be scanned clockwiseapplying the algorithm to a coverage
holes must be scanned anticlockwiseholes have negative areabecause of limited computer precisionresults could be wrong if the area is very small and the coordinate values are very largee.g. in UTM or SPCneed double precision for calculations
but not for resultskeep running total for each polygonfor each arc
proceed segment by segment from FNODE to TNODEon completing all arcs, totals are correct areasadd trapezia areas to R polygon area
subtract from L polygon area
how to measure shape of an area?a compact shape has a small perimeter for a given area
compare perimeter to the perimeter of a circle of the same area
shape = perimeter / [3.54 sqrt (area)]
what use are shape measures?
gerrymanderingother types of districts designed with GIScreating oddly shaped districts to manipulate the votenamed for Elbridge Gerry
today GIS is used to design districts
administrative regionssales districts
the strangest-shaped county