LECTURE 2: GEOGRAPHIC REPRESENTATION
Geographic information
information about some place on the surface of the Earthone of the earliest forms of shared informationor near the surface
at some point in time
storing on paperhunters and gatherers reporting back to the band
"there's good hunting near the old tree"
early stick maps for navigation in the Pacific
drawings on cave walls
the printing press in the 15th Century
information accessible to all
shared knowledge as a human community asset
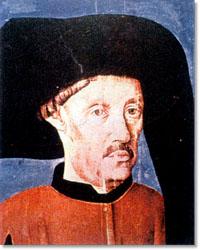
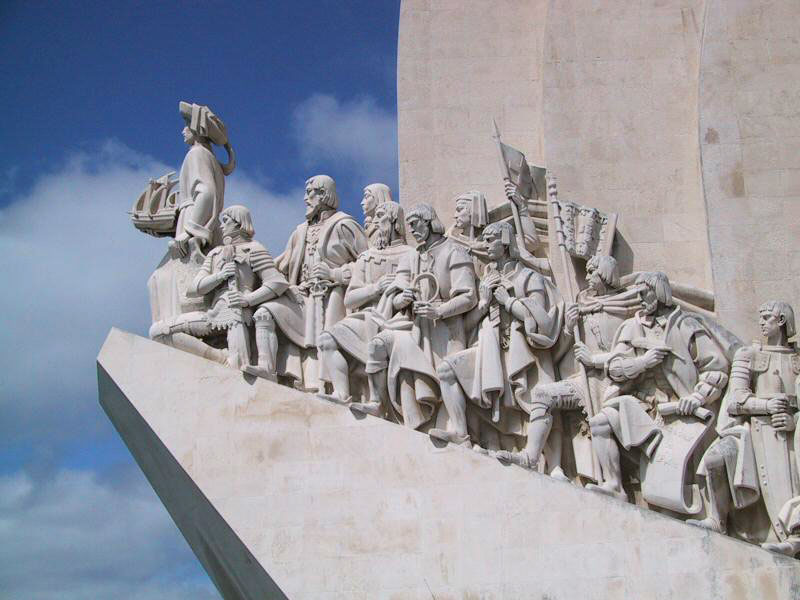
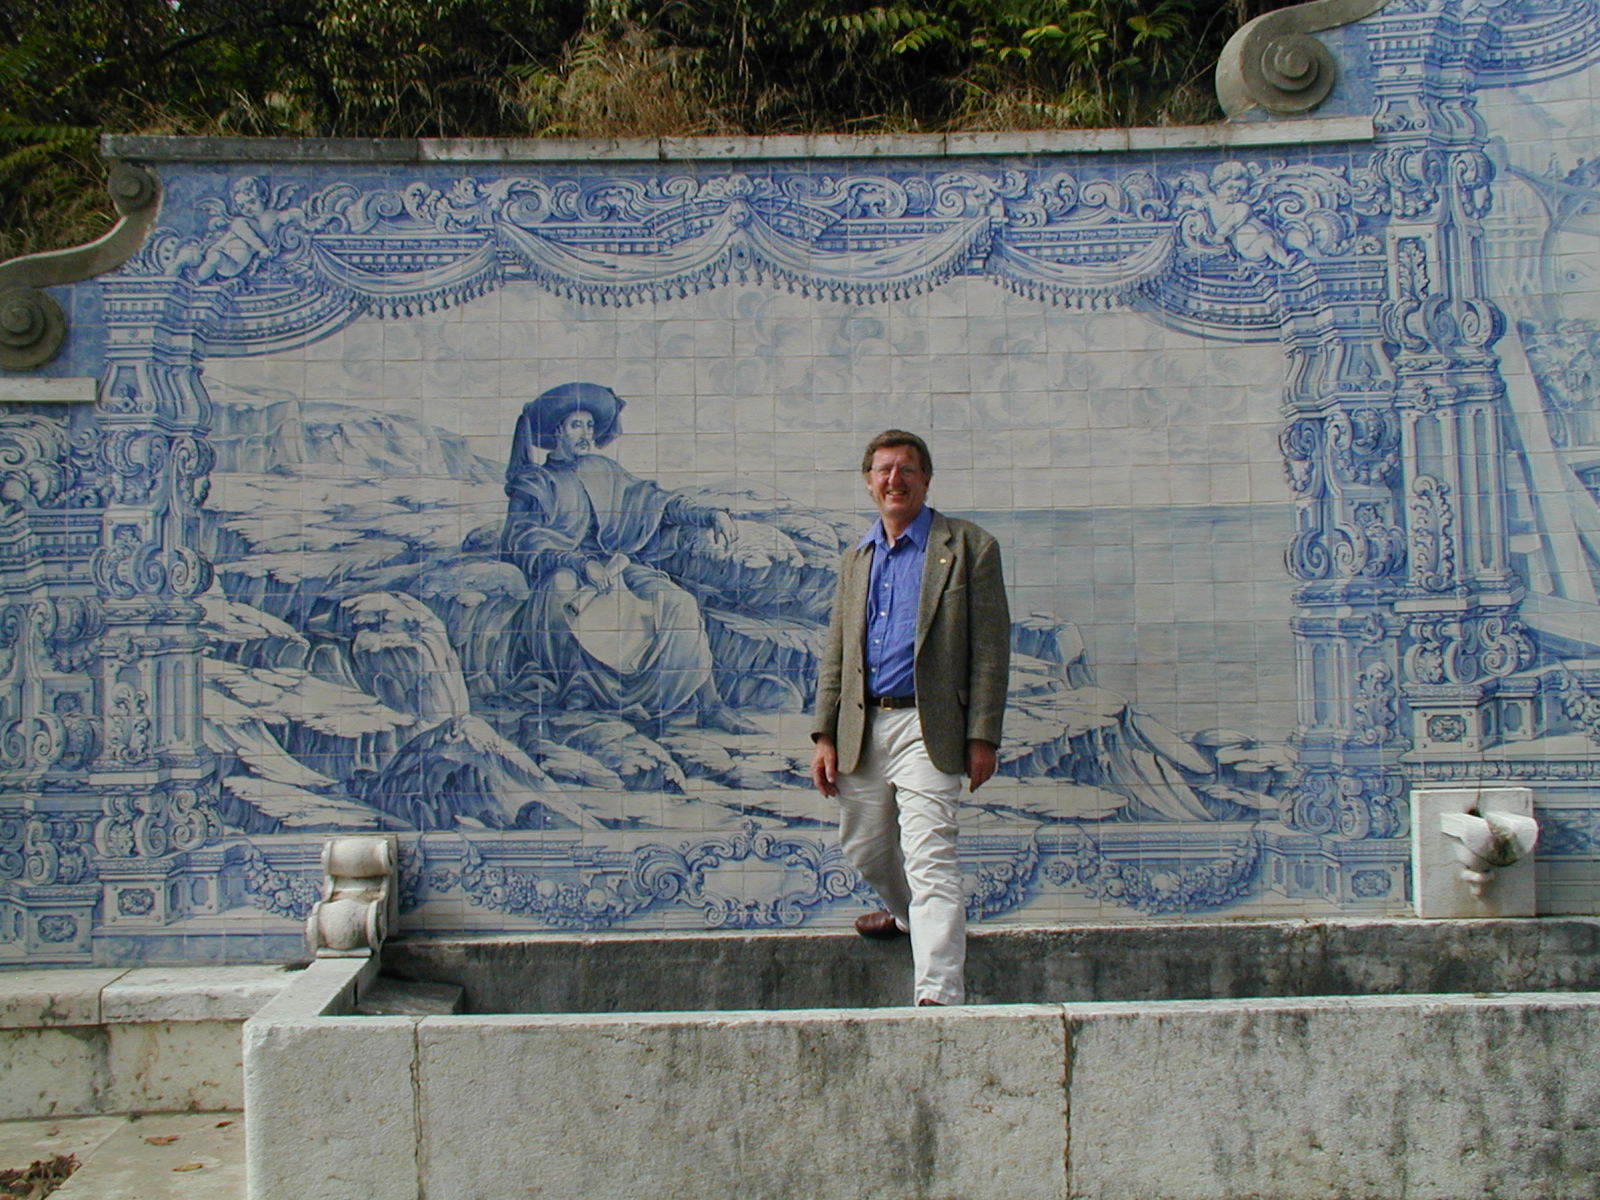
Prince Henry the Navigator, 1394-1460
Lisbon monument to the Discoveries
who would be on his team today?
The Internet
massive new capability for sharing, communicating geographic informationin digital form
The atom of geographic information
<location, time, attribute>general methods for describing locationit's cold today in Ottawa
at 45 North, 75 East at 12 noon EST the temperature was -10 Celsius
everyone around the world understands latitude and longitude
similarly for timeattributes must also be generally understood
"cold" is subjective and relative
-10 Celsius is generally understood
Suppose we could capture it all
Al Gore's dream of a Digital Earthcomplete representation of the planet
past, present, and future
a "mirror world"
Imagine, for example, a young child going to a Digital
Earth exhibit at a local museum. After donning a head-mounted display,
she sees Earth as it appears from space. Using a data glove, she zooms
in, using higher and higher levels of resolution, to see continents, then
regions, countries, cities, and finally individual houses, trees, and other
natural and man-made objects. Having found an area of the planet she is
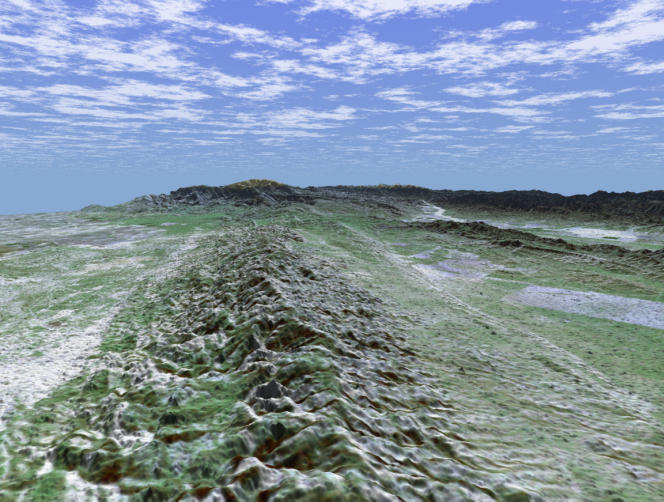
interested in exploring, she takes the equivalent of a magic carpet ride
through a 3-D visualization of the terrain. Of course, terrain is only
one of the numerous kinds of data with which she can interact. Using the
systems voice recognition capabilities, she is able to request information
on land cover, distribution of plant and animal species, real-time weather,
roads, political boundaries, and population. She can also visualize the
environmental information that she and other students all over the world
have collected as part of the GLOBE project. This information can be seamlessly
fused with the digital map or terrain data. She can get more information
on many of the objects she sees by using her data glove to click on a hyperlink.
To prepare for her familys vacation to Yellowstone National Park, for
example, she plans the perfect hike to the geysers, bison, and bighorn
sheep that she has just read about. In fact, she can follow the trail visually
from start to finish before she ever leaves the museum in her hometown.
She is not limited to moving through space, but can also
travel through time. After taking a virtual field-trip to Paris to visit
the Louvre, she moves backward in time to learn about French history, perusing
digitized maps overlaid on the surface of the Digital Earth, newsreel footage,
oral history, newspapers and other primary sources. She sends some of this
information to her personal e-mail address to study later. The time-line,
which stretches off in the distance, can be set for days, years, centuries,
or even geological epochs, for those occasions when she wants to learn
more about dinosaurs. (U.S. Vice President Al Gore, in a speech written
for presentation at the California Science Museum, Los Angeles, January
1998)
How many atoms are there?
Reduce the level of detail, aggregate, generalize, approximatean infinite number
to make a two-word description of every sq km on the planet would require 10 Gigabytes
to store one number for every sq m on the planet would require 1 Petabyte
how to limit?
ignore the waterThe problemthat's 2/3 of the planetone temperature for all of Ottawaone number for an entire polygonsample the spaceall geographic data miss detailonly measure at weather stations
because temperature varies slowly
all are uncertain to some degree
there are many ways of doing this
a GIS user must make choices
GIS designers must allow for many options
geographic description is complex
The most important of the options
how we think about the worldDiscrete objects
points, lines, areas (or volumes) having known propertiesContinuous fieldslittering an otherwise empty space
can be manipulated/edited
can be found in the real world
may overlap
can be counted
represent as shapefileshow many people living in Santa Barbara?
how many vehicles in California?
how many trees growing on the UCSB campus?
how many lakes are there in Minnesota?
how many mountains in Scotland over 3000 ft?
how many clouds in the sky?
how many cities over 1 million population?
how many atmospheric lows in the northern hemisphere today?
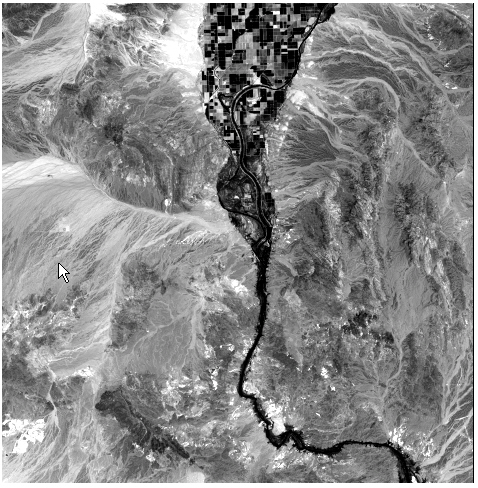
things it's worth measuring at every location on the planetLakes in Minnesotatemperature
soil pH
soil type
land cover type
elevation
rainfall
ownership
each of these variables has one value everywherevariable is a function of location
field = a way of conceiving of geography as a set of variables each having one value at every location on the planet
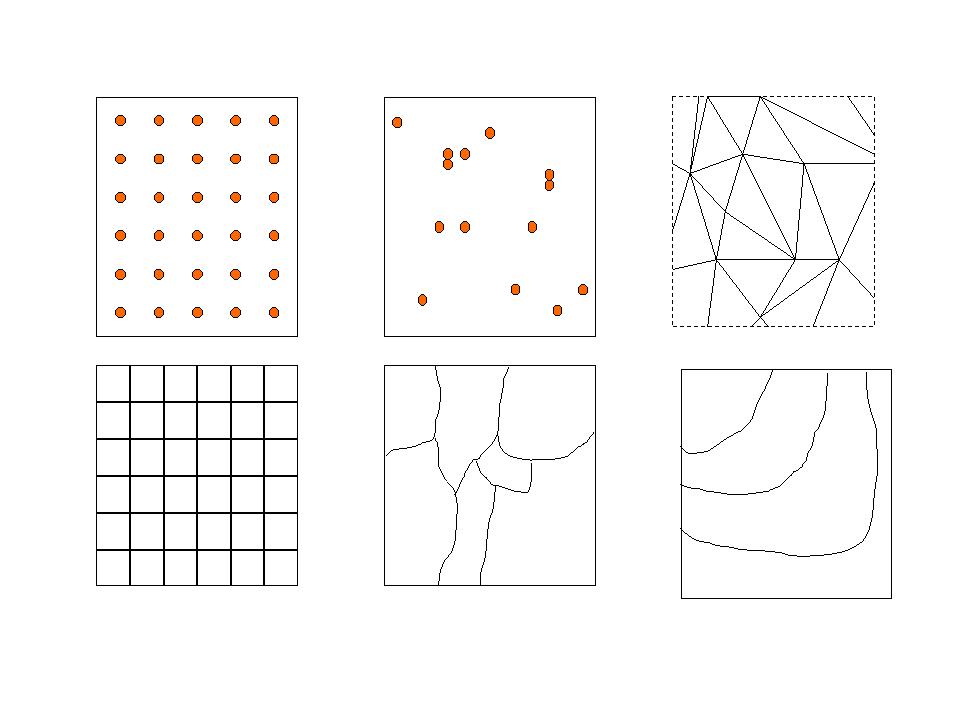
z = f(x,y,z,t)represent one variable as:number of such objects is property of the representation, not the phenomenonpolygons
raster
TIN
sample points
contours
cannot be manipulated
cannot overlap
how many are there?Weather forecasting
fronts, highs, lows, or pressure surfaces?Objects are intuitive, part of everyday life
fields are more associated with scienceBoth objects and fields can be represented either in raster or in vector form
Ontology: the study of the basic elements of description
"what we tell about"
discrete objects and fields are two different ontologies