An overworked term
data modelmodela template for data
relational, object-oriented, coverage, shapefile
concerned with form, how the world looksrepresented by the database
a representation of some real-world process
concerned with process, how the world worksrepresented by software
spatial modeling
manipulation of geographic information in multiple stepsanalog or digital?
steps may represent stages in some complex analysiscalculation of indicatorssteps may represent timegeocomputationdynamic model
iterative analysislooping
analoguse of a scale modeldigital
or some analogous processVarignon frame
electrical flows to simulate water flowsprocess represented in 0s and 1sscale of a digital model?
program in C
GIS script in VBA, Pythonspatial, temporal resolution
define what is left out of the model
leave uncertainty about model predictionsideally, the scale of the model should match the minimum resolution of important system processes
models are often built at coarser scales in order to
reduce model complexity to a managable level
match the scale of available data
scaling data down for use in a finer-scale model is statistically problematic
model components may operate over more than one scale
data may also be entered at multiple scales
model must run faster than the real world
positive or normative?
positive: emulates real-world processes
normative: represents human ideals, desires
Why model?
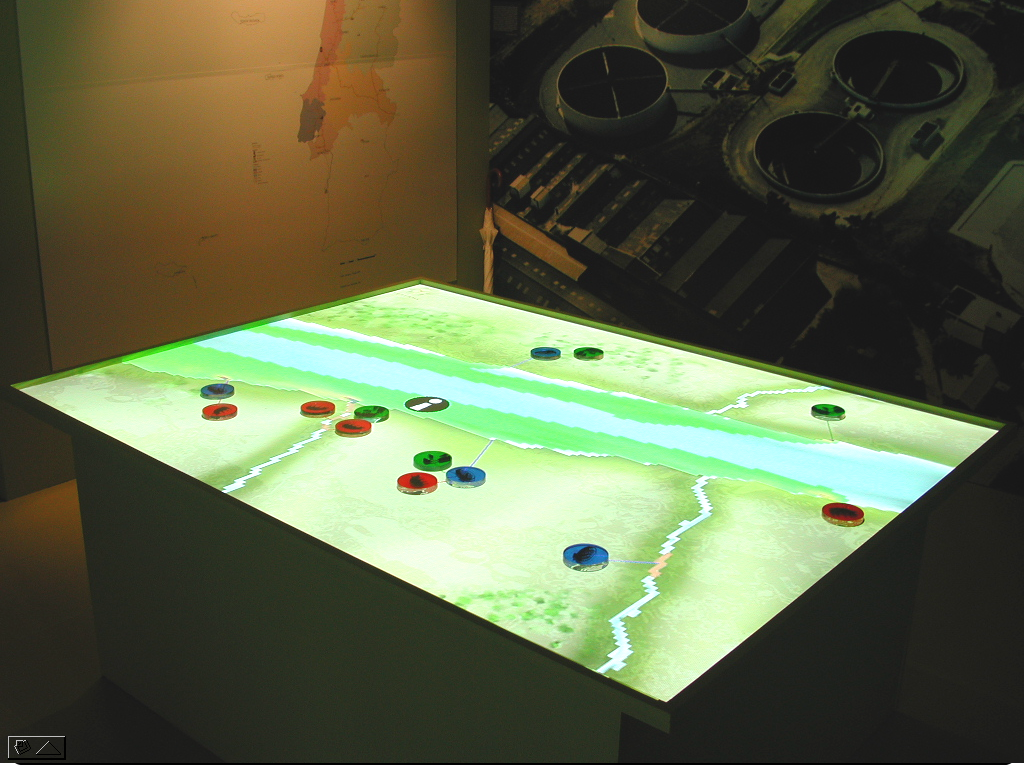
to support some design processTo analyze or model?to allow the user to experiment with a replica
to investigate what-if scenarios
to examine dynamic outcomes
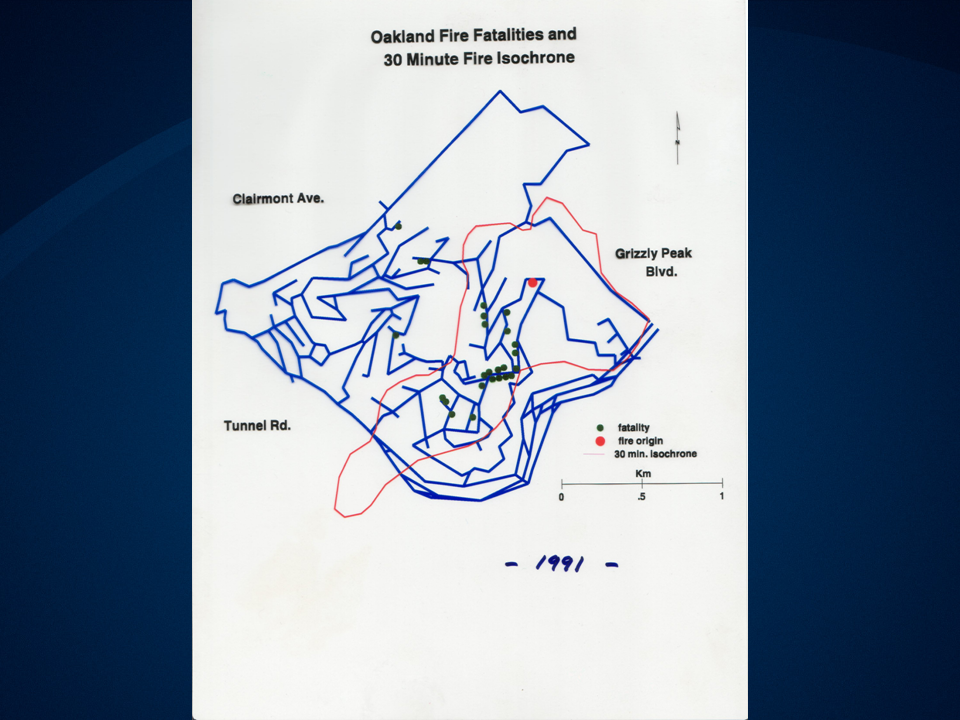
evacuation scenarios
Oakland hills fire
Tom Cova's analysisChurch's simulations
the Paramics polyline problem
analysisstatic, one point in timemodeling
search for patterns, anomalies
generating hypotheses
revealing what would otherwise be invisiblemultiple stages
perhaps different points in time
implementing ideas and hypotheses
experimenting with policy options, scenariosbetter than experimenting on the real thing
Is a model spatial?
four possible tests
invariance test
spatially explicit models (SEM) are not invariant under relocation of the objects of study
representation test
SEM include representation of location in their implementations
formulation test
concepts such as location or distance appear directly in the model
in algebraic expressions or behavioral rules
outcome test
spatial structures of inputs and outputs are different
it modifies the landscape on which it operates
Static models and indicators
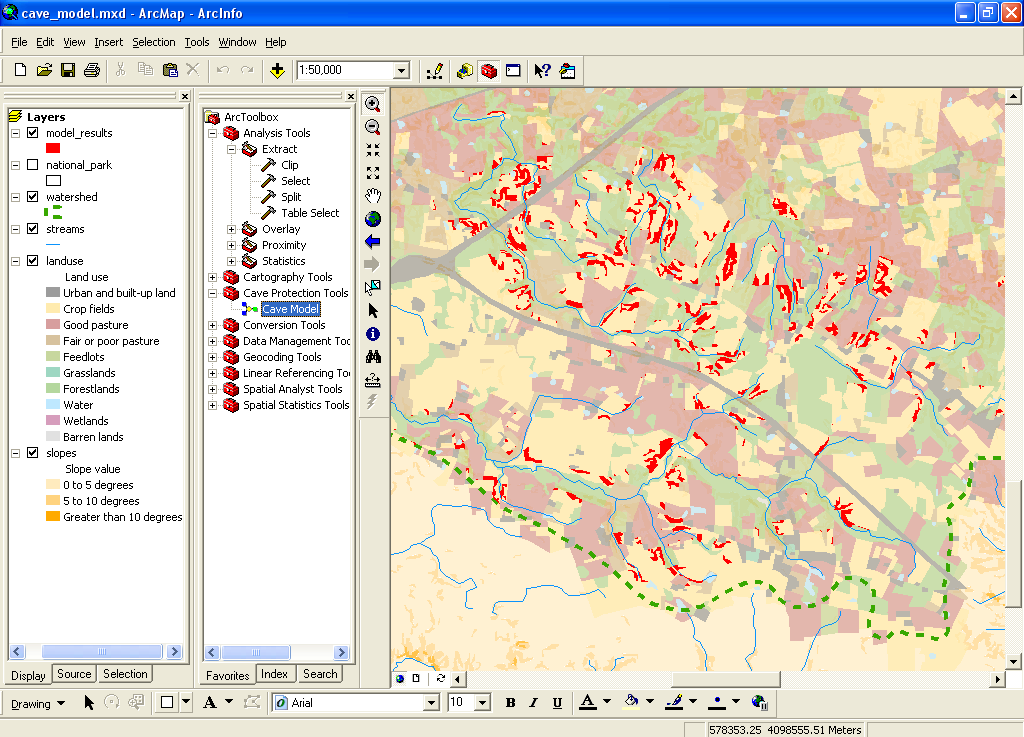
combining GIS layers through overlaye.g., using ModelBuilder
Universal Soil Loss EquationIndividual and aggregate modelsA = R x K x LS x C x PDRASTIC model of groundwater vulnerabilitykarst groundwater protection model
Rhonda Pfaff and Alan Glennononline tutorialModelBuilder screenCanadian case study
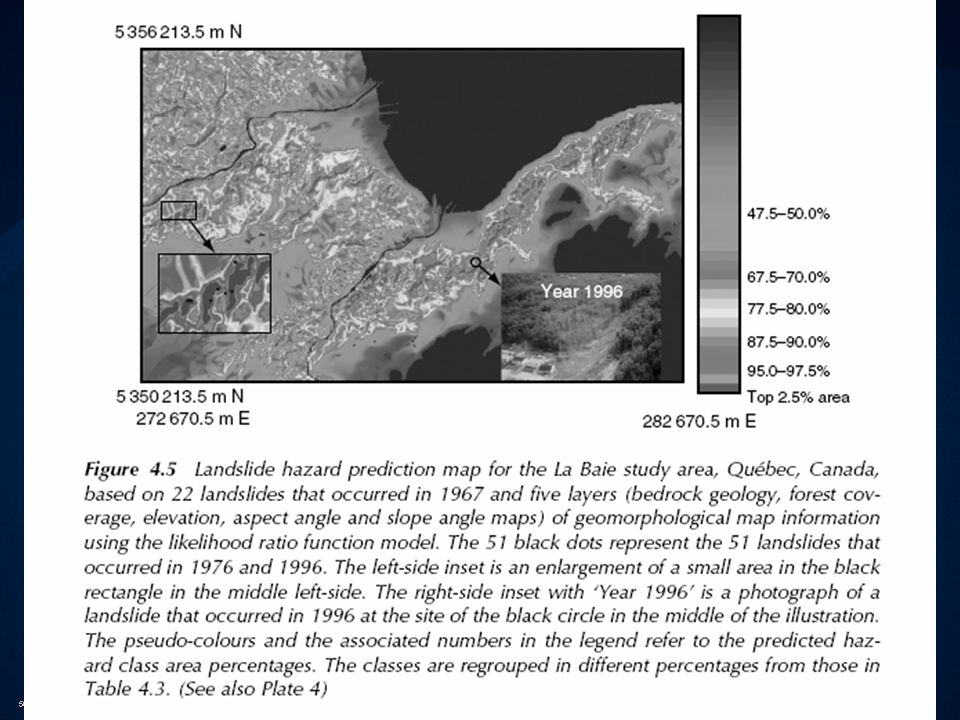
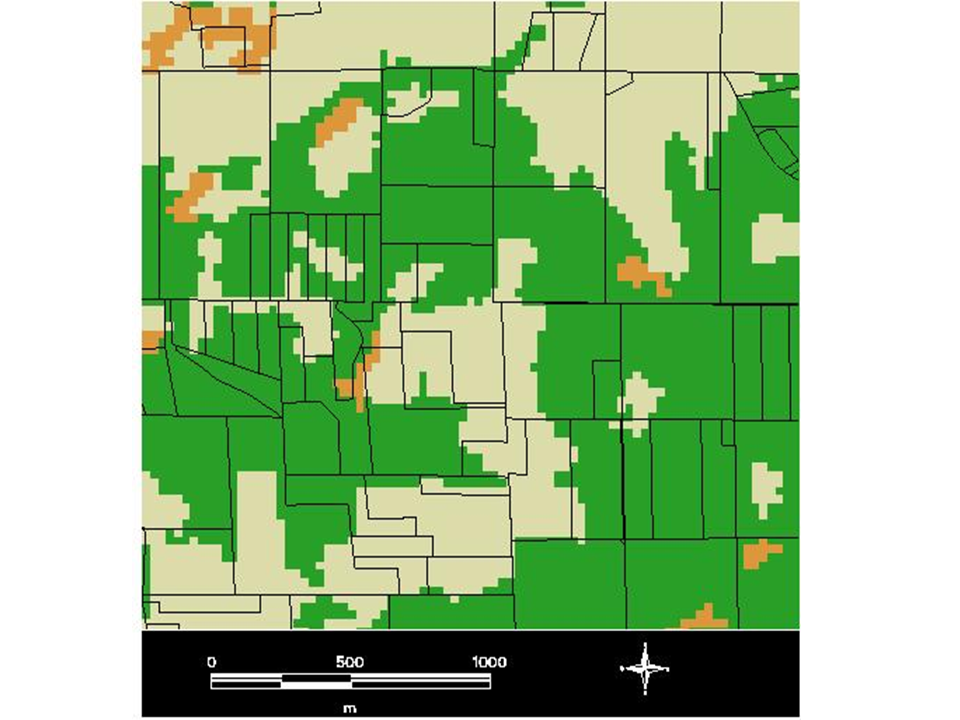
landslide risk in Quebec
marine clays
10km by 6km area
pixels 5m by 5m
1,954,836 pixels
73 landslides in past 40 years
independent variables determining risk
geology
12 lithologic groups
forest cover
binary
elevation
slope angle
aspect
two sets of locations
landslide, no landslide
discriminant function analysis
find the combination of the independent variables that best discriminates
linear combination
a1 x1 + a2 x2 + ...
is it possible to model every individual element in the system?every molecule of groundwater?autonomous agent models
every person in a crowd?crowd behaviorthe Hajjpanic and massive loss of lifethe Notting Hill carnivalorderly
breakdown
Cellular models
on a rastereach cell in one of a number of states
rules of state transition at each timestepbased on states of cell and neighborsKeith Clarke's urban growth model
the Game of Life
vector modeling
less computationally intensive
more difficult to program outside a GIS
more accurate data representation
raster modeling
higher computational and data storage demands
computationally easier to subdivide and aggregate parcels
easier to program outside a GIS
difficulty representing topological relationships inside GIS
rasterization introduces more errors
Graphic interface
ModelBuilderScriptsaccess to all ArcGIS functions
looping
ArcGIS
Visual Basic for ApplicationsArcScripts
Perl
Python
JScript
Model coupling
linking model software to GIS
e.g. Paramics and GIS
loose coupling
exchanging filesclose couplingcommon files, common interface
Multiple factors affect decisions
three in the Pfaff and Glennon caseslope > 5%
land use = cropping
distance from stream < 300msimple binary decision
overlay three layers
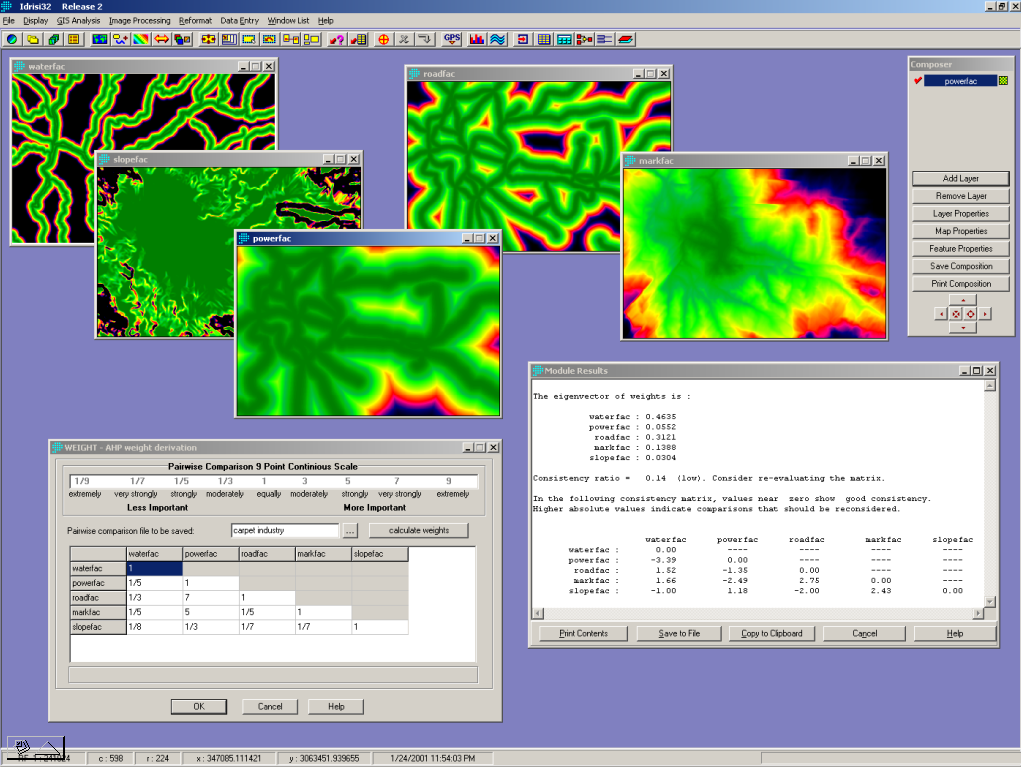
how to assign weights to each factor?Analytical Hierarchy Processstakeholders may disagree on weightsMCDM = multicriteria decision making
devised by Thomas Saatyeach stakeholder compares each pair of factors
assigns comparative weightse.g., slope 7 times as important as land useforming a complete matrix
e.g., distance from stream 1/2 as important as slope
slope land use distance from stream slope 7 2 land use 1/7 1/3 distance from stream 1/2 3 analyze to obtain consensus weights
How to know if the model is correct?
can its results be trusted?Sensitivity testingresults from a computer are often trusted implicitlyhow to calibrate the model?to make its results match observationa model is never more than an approximation to realitye.g., to make the results of the Clarke model match previous growth patterns in SBbut how good/bad is the approximation?important to provide measures of confidence in results
varying the inputs to observe effects on outputsError propagationsome inputs affect outputs more than others
these are the inputs that most need to be correct
examining the impacts of input errors on outputsmostly by simulation