LECTURE 12: ANALYSIS (3)
Ways of capturing the properties of data sets in simple summaries
compare the mean a descriptive summary of a set of numbers
the median for ordinal data
the mode for nominal data
what's the equivalent of the mean for spatial data? the average location, the center
for points:
(weighted) average of coordinates
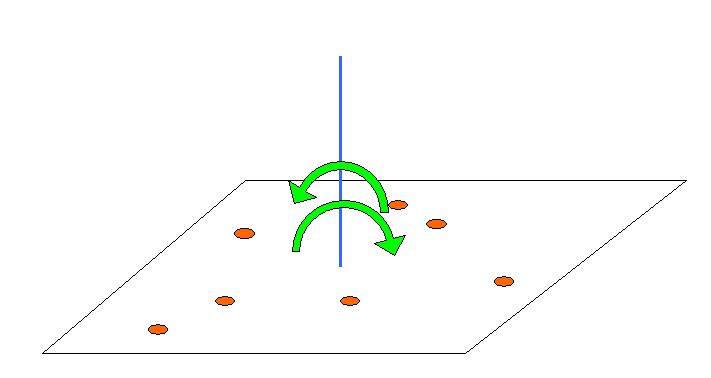
the balance pointthe centroid for polygons:
centroid or balance point
a good place for a labelnot the average of coordinates
calculation based on trapezia
compare calculation of area
in GIS "centroid" = any representative point
how many US county centroids lie outside their counties?
countries? Somalia (Ethiopia), Vietnam (Laos)
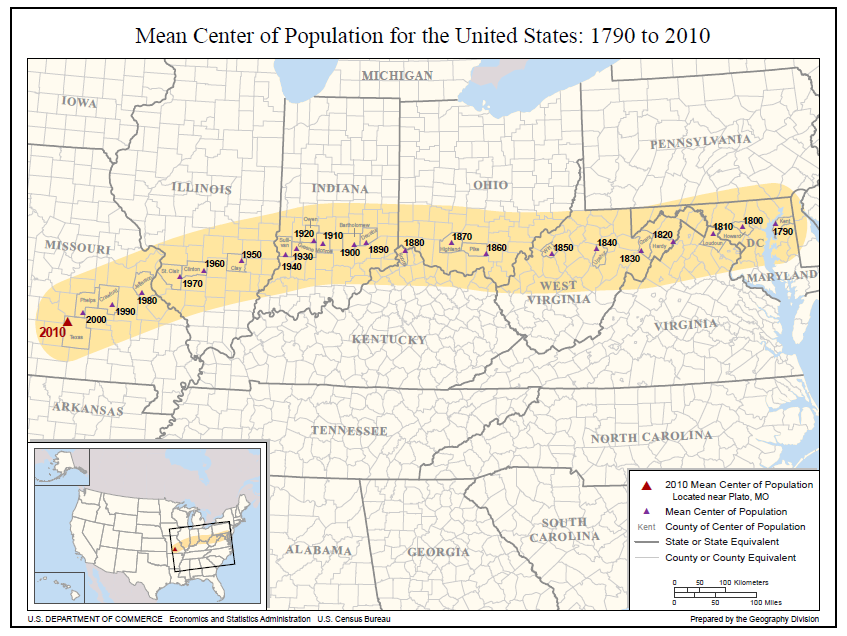
centers are valuable for tracking changes in data sets through time
e.g. the US center of population
centers are valuable as sites for services to serve dispersed populations
by minimizing distances
the most accessible point
centroid minimizes distance squared
point of minimum aggregate travel (MAT)
not the centroid
the Varignon Frame experiment
an analog computer
a digital computer must use an iterative search to find the MAT
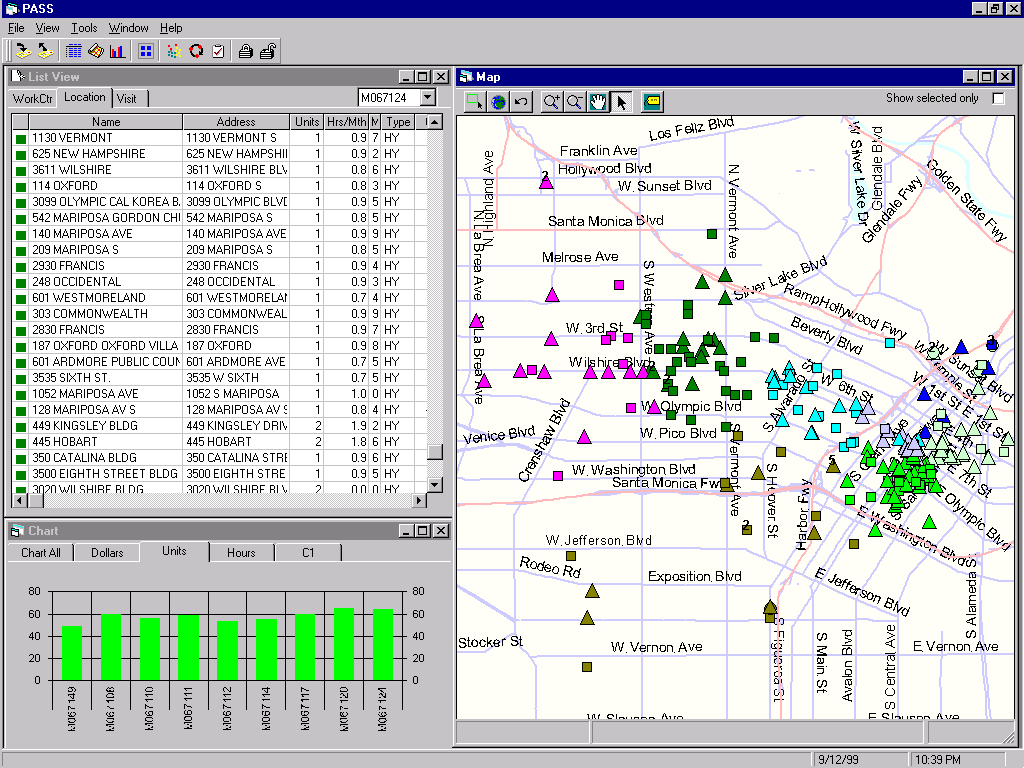
location-allocation
search for optimum locations for any central facility
schools
fire stations
hospitals
retail stores
restaurantsdispersion around the center
mean distance from the center
standard deviation ellipse
Using an analysis to create designs that improve, or optimize
finding the best location for a {point, line, area}Spatial decision support systems (SDSS)working with a community to select the best option
evaluating what-if scenarios
systems that aid in decision-making about spatial issuesExampleswhere to put things?which plan to select? simulation of effects and impacts of decisions and alternatives
scenario evaluation
site selectionlogistics - Schindler Elevator
Statistical significance
Drug X produced a lower rate of heart attacks than for a control group, but is the reduction significant?The data as a sampleis the amount more than you would expect by chance?
chance will always produce some impact
but how much is expected?
drawn randomly from a much larger population of possible valueseach member of the population has an equal probability of being chosenthe process of drawing a sample produces variation among sampleshow much is expected by chance?
is the observed amount more than this?
Example
Hypothesis testing with spatial datawhat is the relationship between vegetation and elevation in California?
does White Fir (WF) grow at a higher elevation than Mixed Conifer Pine (MP)?
Calveg 1977
land cover map
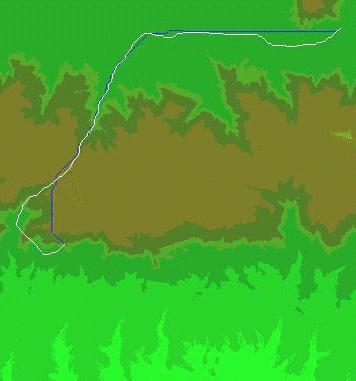
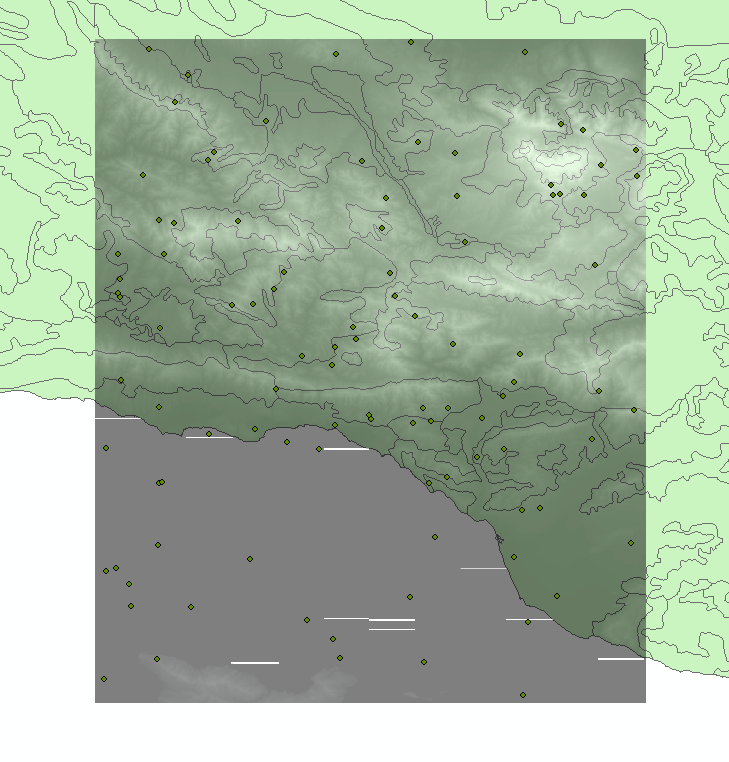
30m DEM of Santa Barbara area
can we generalize results from this one area to all of CA?
how to sample?
100 points
randomly located
generate in Excel
x from 0 to 92000
y from -446000 to -335000
overlay on vegetation polygons
summarize
no points in WF
10 in MP
but why 100?
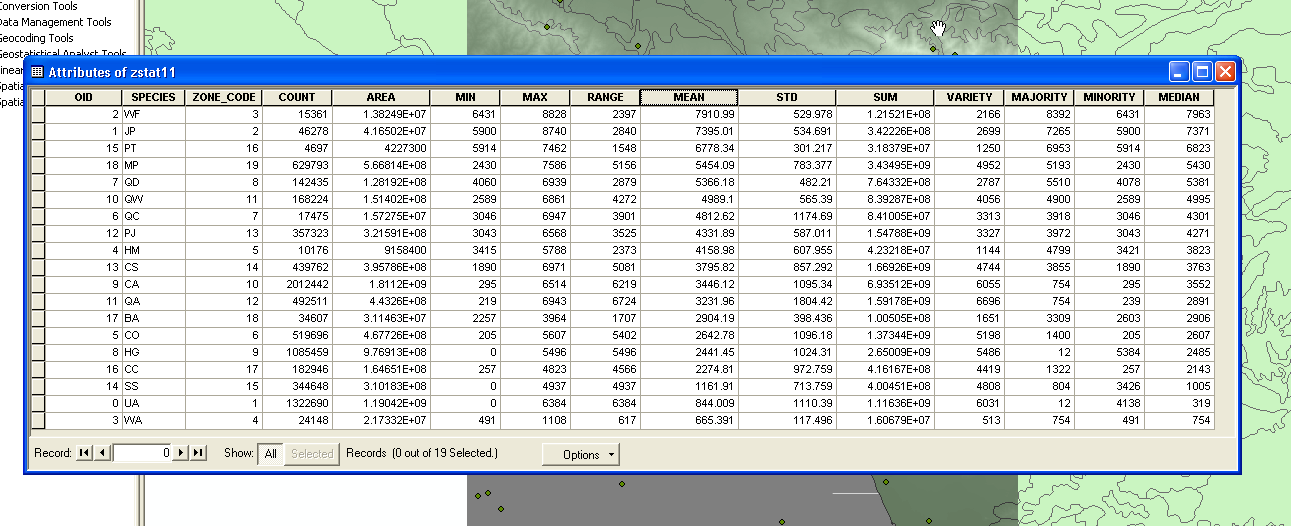
identity, summarize
mean elevation of WF = 7911ft
mean elevation of MP = 5454ft
but what about the ranges?
hypsometric curves for each class
standard deviations
WF = 530ft based on 15361 points
5454 is 4.64 standard deviations below the mean
MP = 783ft based on 629793 points
7911 is 3.13 standard deviations above the mean
significance test
what is the chance that two samples have been drawn from the same population?
randomly and independently
are not significantly different?
2-sample t test
with samples of this size there's no doubt about the outcome
why not interpolate even more data points?
because they wouldn't be independent samples
what are the data a sample of?Hypothesis testing with spatial data is problematicwhat is the population?is the sample drawn independently?e.g. what are all LA census tracts a sample of?
all US census tracts?
all possible versions of LA?Tobler's First Law of Geography
but is it necessary?much GIS analysis is simply descriptive
no need to assess significance
no need to generalize to a larger population
Options
1. throw away data
so that Tobler's First Law is no longer true
cases are truly independent
samples spaced beyond the range
but this only fixes the spatial dependence problem
2. deal directly with the spatial dependence
geostatistics
spatial statistics
3. no generalization, no significance tests