INTRODUCTION TO SPATIAL ANALYSIS
Michael F. Goodchild
1. HOW TO ORGANIZE THE POSSIBILITIES
A list of GIS functions
75Multistage visualization2,000
anything one can think of doing on spatial data
boxes are data sets, links are operations
ERDAS ImagineScripting languagesESRI Spatial Modeler
Stella
describe analysis as a linear sequence of operationsBy object type
e.g. Bailey and Gatrell Interactive spatial data analysis Harlow, UK: Longman Scientific and Technical (1995):By six classesA. Point patterns
B. Spatial continuous data (fields of interval/ratio variables)
C. Area dataspatially intensive or spatially extensiveD. Spatial interaction datathe cartographic problem
how to model spatial interaction?<origin object, destination object, attributes>
queries and reasoningmeasurements
transformations
descriptive summaries
optimization
hypothesis testing
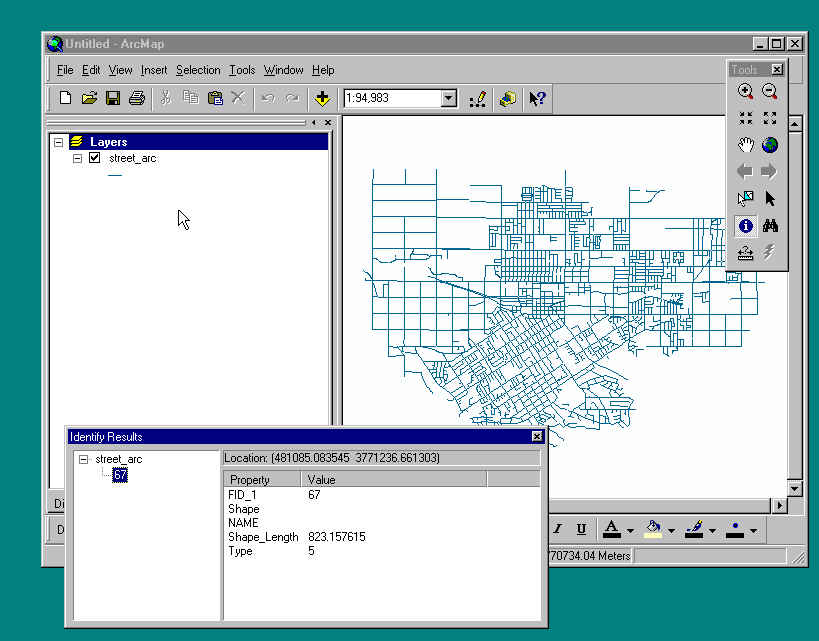
Interacting with views
catalog viewSQLiconsmap viewlocationtable viewhistogram, pie chart
scatterplot
linked views
exploratory spatial data analysis
SELECT... FROM... WHERE...Spatial reasoning
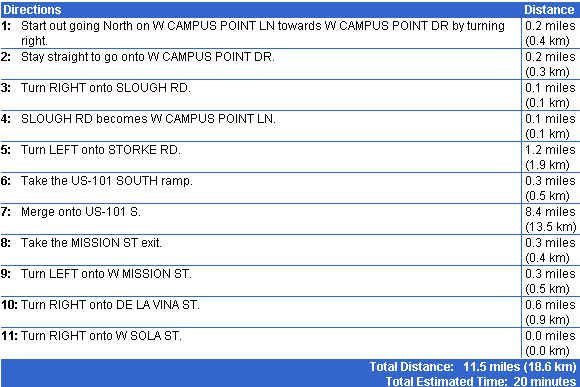
e.g. route-finding directions
www.mapquest.comDriving directions from 909 West Campus Lane to 1401 De La Vina Stmap view
Go that way (pointing) and turn right at the fence. When the road curves to the right head straight, under the big coral tree. Turn left at the first stop sign, pass the daycare center on the right, and turn right at the stop sign at the end. At the light head straight through, and follow Storke through two more lights (the second one is Hollister). At the third light turn right to take the ramp onto 101 South (it's actually heading east at this point). In about eight miles take the Mission Street exit, and turn left at the bottom of the ramp. Go through three lights, watch out for the sharp dip in the road at Bath, and turn right on De La Vina. 1401 is at the corner of Sola, one block after the light at Micheltorena.
The original motivation for GIS
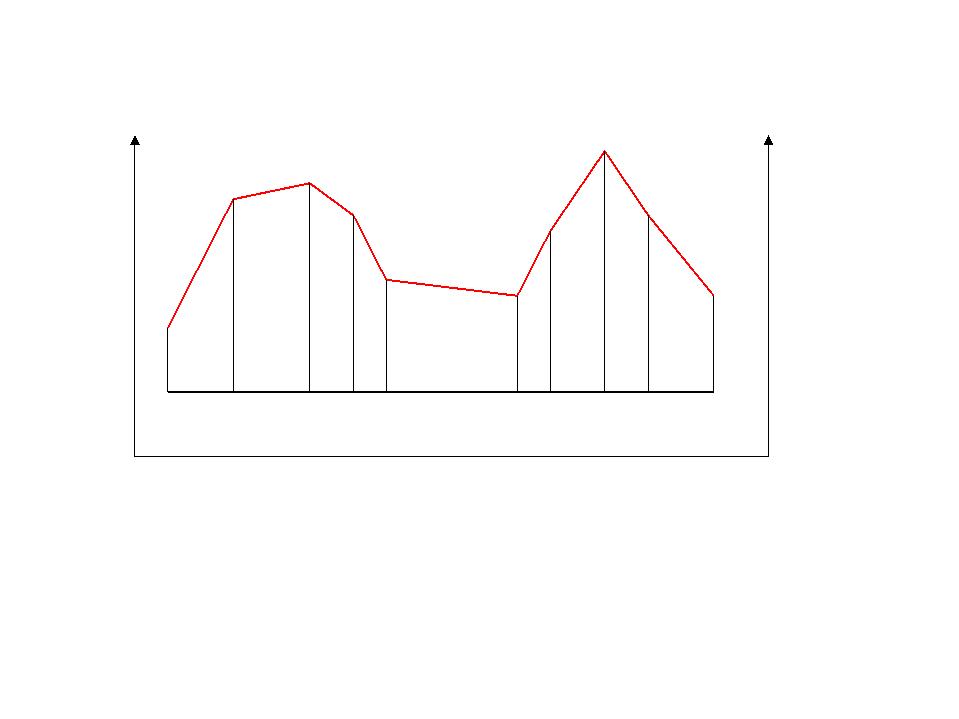
the Canada Geographic Information System of 1965Distance metricsmeasurement of area
planimetryoverlay of layers to obtain joint areasdot counting
PythagoreanBias in the length of a polyline
relative to a true lineArea of a polygon
Shape
Elbridge Gerry and the salamanderIn 1992, following the release of population data from the 1990 Census, new boundaries were proposed for the voting districts of North Carolina. For the first time race was used as an explicit criterion, and districts were drawn that as far as possible grouped minorities (notably African Americans) into districts in which they were in the majority. The intent was to avoid the historic tendency for minorities to be thinly spread in all districts, and thus to be unable to return their own representative to Congress. African Americans were in a majority in the new 12th District, but in order to achieve this the district had to be drawn in a highly contorted shape.
The new district, and the criteria used in the redistricting, were appealed to the U.S. Supreme Court. Writing for the 5-4 majority, and striking down the new districting scheme, Chief Justice William Rehnquist wrote that "A generalized assertion of past discrimination in a particular industry or region is not adequate because it provides no guidance for a legislative body to determine the precise scope of the injury it seeks to remedy. Accordingly, an effort to alleviate the effects of societal discrimination is not a compelling interest."
perimeter for a given areashape = perimeter / (3.54 sqrt area)1 for a circle (most compact)
>1 otherwise
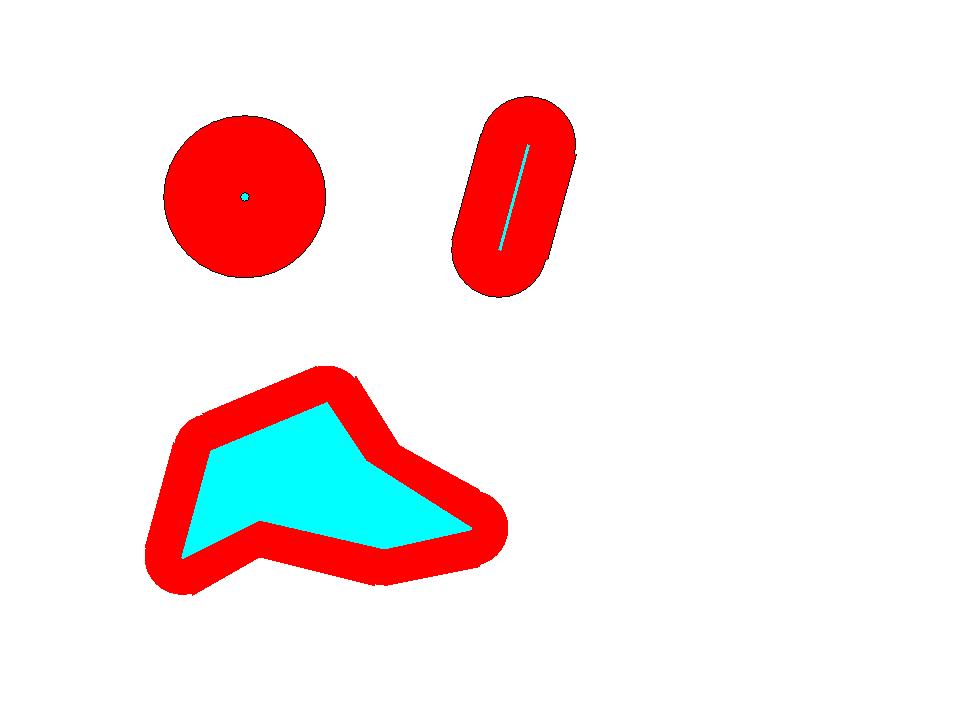
Buffering
dilationPoints in polygonserosion
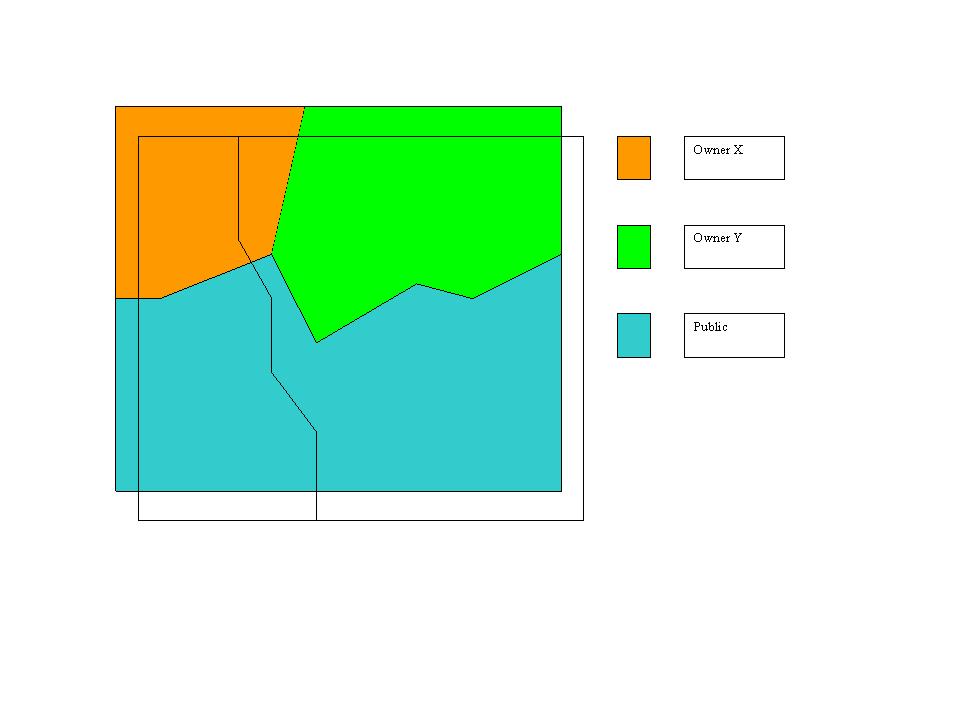
Polygon overlay
the discrete object caseSpatial interpolation
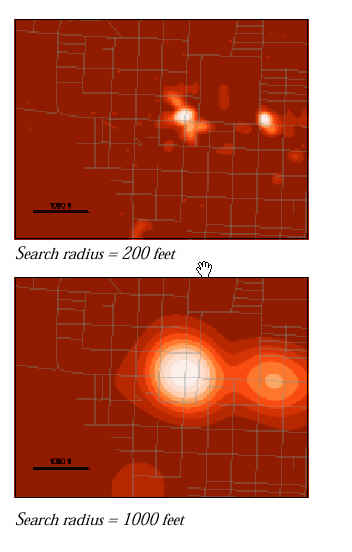
estimation of the value of a field variable at a location where it has not been measuredDensity estimationat all locationsinverse distance weightingcontouring
Kriging
estimation of the density of discrete objectsreplacing each object by a suitably weighted kernel functionresult depends on the radius of the kernel
Statistics that summarize a distribution
and satisfy the test for whether a method of analysis is spatialBy analogy to one dimension:reducing a potentially complex system to a few numbers
that are relevant to a question or application
measures of central tendencyTwo-dimensional versions of the mean and their variational propertiesmeasures of dispersion
skewness, kurtosis
centroidApplications of centersminimizing distance squaredmedianthe balance point
means of coordinates
minimizing distancebivariate medianminimizing Manhattan distance
summarizing change through timeDispersionwestward march of the US population centroidsite selectionthe Mendeleev Centrographic Laboratory
mean distance from centerMeasures of spatial dependence
the First Law of GeographyMeasures of fragmentationall things are related but nearby things are more related than distant thingsGeary and Moran statisticsendemic in geographic information
Type II errors
variograms
FRAGSTATSMeasures of fractional dimension
Measures of clustering
the K function
Design to achieve specific objectives
pointsLocation of central point-like facilities
lines
areas
to serve dispersed demandLocation of linear facilitieslocation-allocation methods
central facilities location
retailing
agency offices
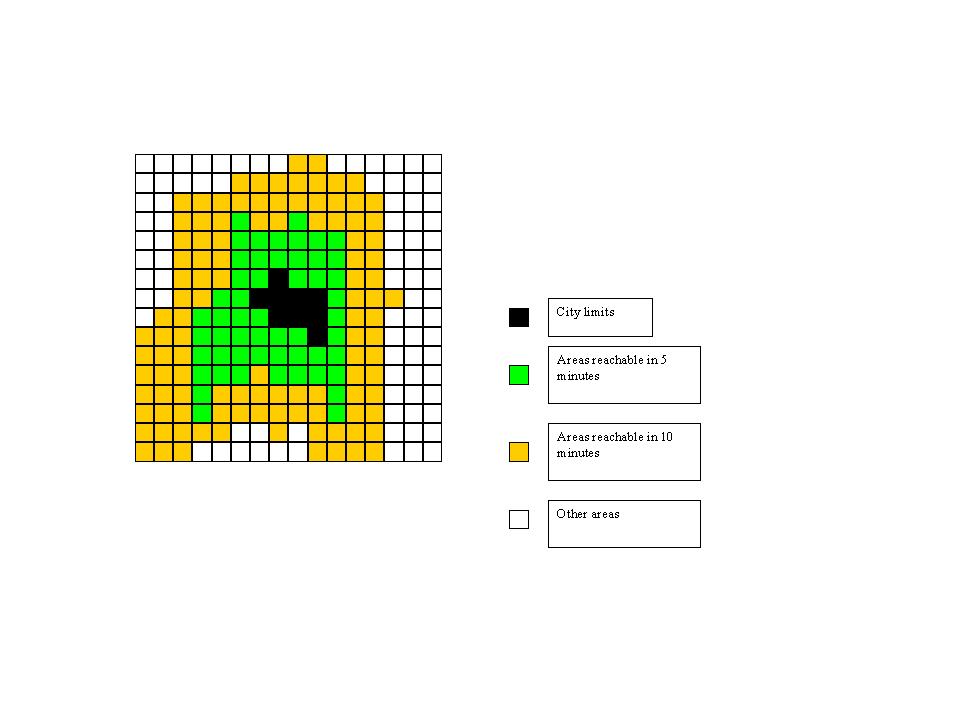
emergency facilities
recreation facilities
delivery routes
power lines, highways, transmission corridorsLocation of areas
political districting
Application of inferential methods
based on traditional statistical methodsInferencenull hypothesistest statistic
known distribution under the null hypothesis
alpha level
Type I and Type II errors
from a sample to a populationThe independence assumptionsample is drawn randomly and independently
geographic objects as samples
the entire population is often analyzedinference about what population?
and the First Law of GeographyRandomization tests