Lecture 1: The GIS Project Lifecycle
What is a GIS project?
Chapters 1 and 2
what are a project's components?
what makes a successful project?
practical criteria
reliable
meets defined needs
uses tools appropriately
used as expected when planned
user interface appropriate for users
apply these criteria to ADL, LA Collaboratory
reliable
is it always up?
meets defined needs
an online version of the MIL?
allows users to access the project
uses tools appropriately
Google Maps, relational database
OpenStreetMap, WMS
used as expected
initial user requirements studies with focus groups
hits?
user interface appropriate
could a high-school student figure it out?
Two models of projects
service model
provides a defined service to a defined user community
discovery model
uses GIS to add to body of scientific knowledge
service model
designed to provide specific types of information to a defined community of users
maps, visual displays
tables
answers to queries
spatial decisions
examples
NYFD
paper maps showing buildings, infrastructure, occupancy, hazardous materials
general public
driving directions
high-resolution images of neighborhoods
locations of restaurants, shopping
real-time status of flights, buses
visitors to UCSB
customized maps of campus, parking, destinations
city property owners and potential investors
maps of assessed value, ownership
National Park
maps of land cover, trails, endangered species
stages in a successful service project:
1. Who are the users?
what evidence is there that they want the service?
"build it and they will come"
what is the business case?
who will pay?
the user
per service fee
license, subscription
advertisers
the taxpayer
or is the effort pro bono?
2. What decisions do the users need to make?
how frequently?
3. What information is needed to support those decisions?
maps, tables, answers to queries?
make a sketch, mockup a storyboard
4. What data are needed?
what layers?
what spatial resolution, accuracy?
how current?
static data, real-time, or what?
where can they be found?
are the available data sufficiently accurate and current?
what will be the structure of the geodatabase?
Visio layout
what classes, attributes, methods?
what relationships between classes?
5. What procedures will need to be executed on the data to create the information?
GIS procedures
as simple as displaying a map
as complex as simulation modeling
what tools are available to execute the procedures?
GIS or something else?
6. Are the users satisfied?
how does the project match up against the 5 criteria listed earlier?
7. What about long-term maintenance?
how often will the data be refreshed?
what if the staff leave?
will the service be archived?
Example: San Nicolas wetland
1. Who are the users?
campus specialists on natural area restoration
ecologists
hydrologists
campus planners
they asked for it
business case: pro bono
2. What decisions do the users need to make?
grading
planting
exotic species removal
3. What information is needed to support these decisions?
maps of wells, water table, land surface
4. What data are needed?
well locations
land surface
water depth
current vegetation cover
5. What procedures will be needed?
data input
edgematch two images
Photoshop
registration
interpolation
kriging
display
6. Are the users satisfied?
7. Long-term maintenance?
Architecture options
single user
ArcGIS
interface customized?
results communicated to ultimate user
multiple users
client-server
Web service
ArcIMS
customized interface
limited functionality
programming required
Discovery model
discovering new knowledge
exploratory
looking for patterns, anomalies
coming up with new theory, new explanations, new questions
confirmatory
testing some existing theory
Project life cycle
1) Define area of knowledge
scientific discipline, subdiscipline
2) What is it we do not know?
a) how ethnicity has changed in LA neighborhoods over 50 years
what patterns of change have occurred
what they reveal about processes of residential location
b) what factors defined patterns of settlement in pre-Columbian Peru
what were the most important factors?
c) what transitions have occurred in beach habitat over 50 years
and how has this impacted Snowy Plover nesting?
d) where have landslides occurred in Southern California
and what factors determine their likelihood?
e) whether settlements in the San Joaquin valley can be predicted from central place theory
what is the scientific question?
inference from form to process
from pattern to theory
3) What methods will be used to answer the question?
data resources
sampling, choice of study area
resolution, accuracy
sources
compromises
substitutes for ideal data
geodatabase design
interoperability issues
format, registration, joins
methods of analysis
ArcGIS procedures
other procedures
4) Does the question need to be modified?
preliminary results
more data
feedback loop
5) Can the results be generalized?
is the sample data representative of some larger universe?
6) What new questions arise?
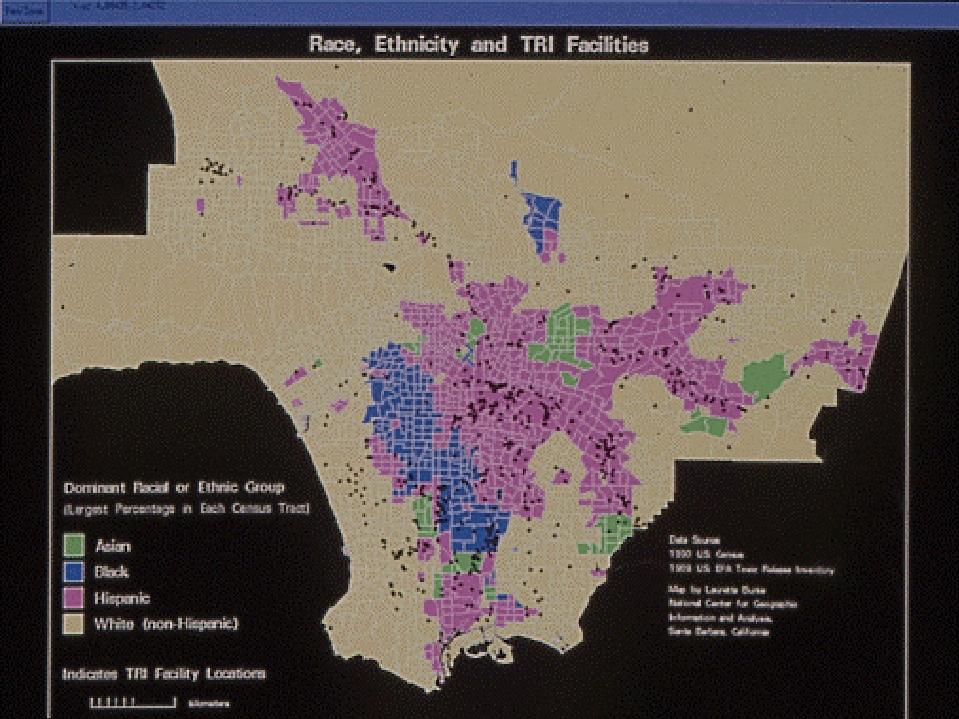
Lauretta Burke's work on LA environmental equity
1) area of science?
environmental justice, environmental equity
geography
2) what is it we do not know?
whether minorities experience elevated levels of atmospheric pollution (form)
whether polluting industries are deliberately located in minority areas (process)
3) methods?
data
EPA Toxic Release Inventory
accuracy of geocoding
dates of validity
Census data on ethnicity
undercounting
modifiable areal unit problem
same results with different tract boundaries?
positional accuracy
methods
visual
tabulation
how many sites in each area?
more than expected?
if sites are located randomly
relationship between sites and income
higher density in areas of low income
4) change the question?
5) generalize?
does this knowledge apply anywhere else?
6) new questions?
other types of pollution
direct evidence of location decisions
Project timeline
leisurely tradition
emergency management requires speed
increasing amounts of real-time data
data being updated more often
trigger factors
when to replace data
when to re-run analysis
school board evaluating school locations
retailer evaluating sites
Summary
many types of projects
two models
service
discovery